
August 2026 research edition
Denver Housing Market, August 2026: More Listings, Fewer Contracts

Published
Data through · Extracted
Denver-area new listings increased 6.4% in August 2026, while accepted-contract activity fell 11.3% from August 2025. Across Adams, Arapahoe, Broomfield, Denver, Douglas and Jefferson counties, REcolorado / InfoSparks recorded 4,731 new listings and 3,137 pending listings. That equals 66.3 pending listings per 100 new listings, down from 79.5 a year earlier.
The change points to weaker contract activity relative to the flow of new listings. It does not establish how likely an individual home is to sell, and it does not mean inventory increased by the difference between those counts.
What changed in the Denver housing market?
The six-county area recorded 286 more new listings and 398 fewer pending listings than in August 2025. Pending listings count properties on which contracts were accepted during the month; they are not the total number still awaiting closing at month end.
Scroll horizontally to see all columns.
| Six-county measure | August 2025 | August 2026 | Year-over-year change |
|---|---|---|---|
| New listings | 4,445 | 4,731 | +6.4% |
| Pending listings | 3,535 | 3,137 | −11.3% |
| Closed listings | 3,490 | 3,118 | −10.7% |
| Active listings at month end | 12,696 | 12,686 | −0.1% |
| Pending listings per 100 new listings | 79.5 | 66.3 | −13.2 percentage points |
Source for all tables and charts: REcolorado / InfoSparks, extracted September 22, 2026. Calculations use unrounded counts. The six-county definition above is this report's reporting area, not an official metropolitan boundary.
The almost unchanged inventory count is an important qualification. New listings are a flow into the market; active inventory is a stock measured at month end. Listings can enter or leave active status for several reasons. These aggregate downloads do not track those transitions property by property.
Which Denver-area counties showed the widest gap?
Denver County combined a 10.2% increase in new listings with a 13.5% decline in pending listings. The difference between those growth rates was 23.7 percentage points, the widest among the six core counties.
Douglas County had the steepest percentage decline in contracts, at 21.7%. Its new listings also fell, by 3.3%. That distinction matters: Douglas's weaker contract flow did not depend on a surge in new listings.
Scroll horizontally to see all columns.
| County | New listings, Aug. 2026 | New listings YoY | Pending listings, Aug. 2026 | Pending listings YoY | Pending per 100 new |
|---|---|---|---|---|---|
| Adams | 841 | +5.0% | 562 | −14.3% | 66.8 |
| Arapahoe | 991 | +3.2% | 672 | −7.7% | 67.8 |
| Broomfield | 125 | +14.7% | 93 | +17.7% | 74.4 |
| Denver | 1,155 | +10.2% | 634 | −13.5% | 54.9 |
| Douglas | 693 | −3.3% | 506 | −21.7% | 73.0 |
| Jefferson | 926 | +14.3% | 670 | −3.3% | 72.4 |
| Six-county total | 4,731 | +6.4% | 3,137 | −11.3% | 66.3 |
| Boulder, separate comparison | 523 | +0.4% | 308 | −15.2% | 58.9 |
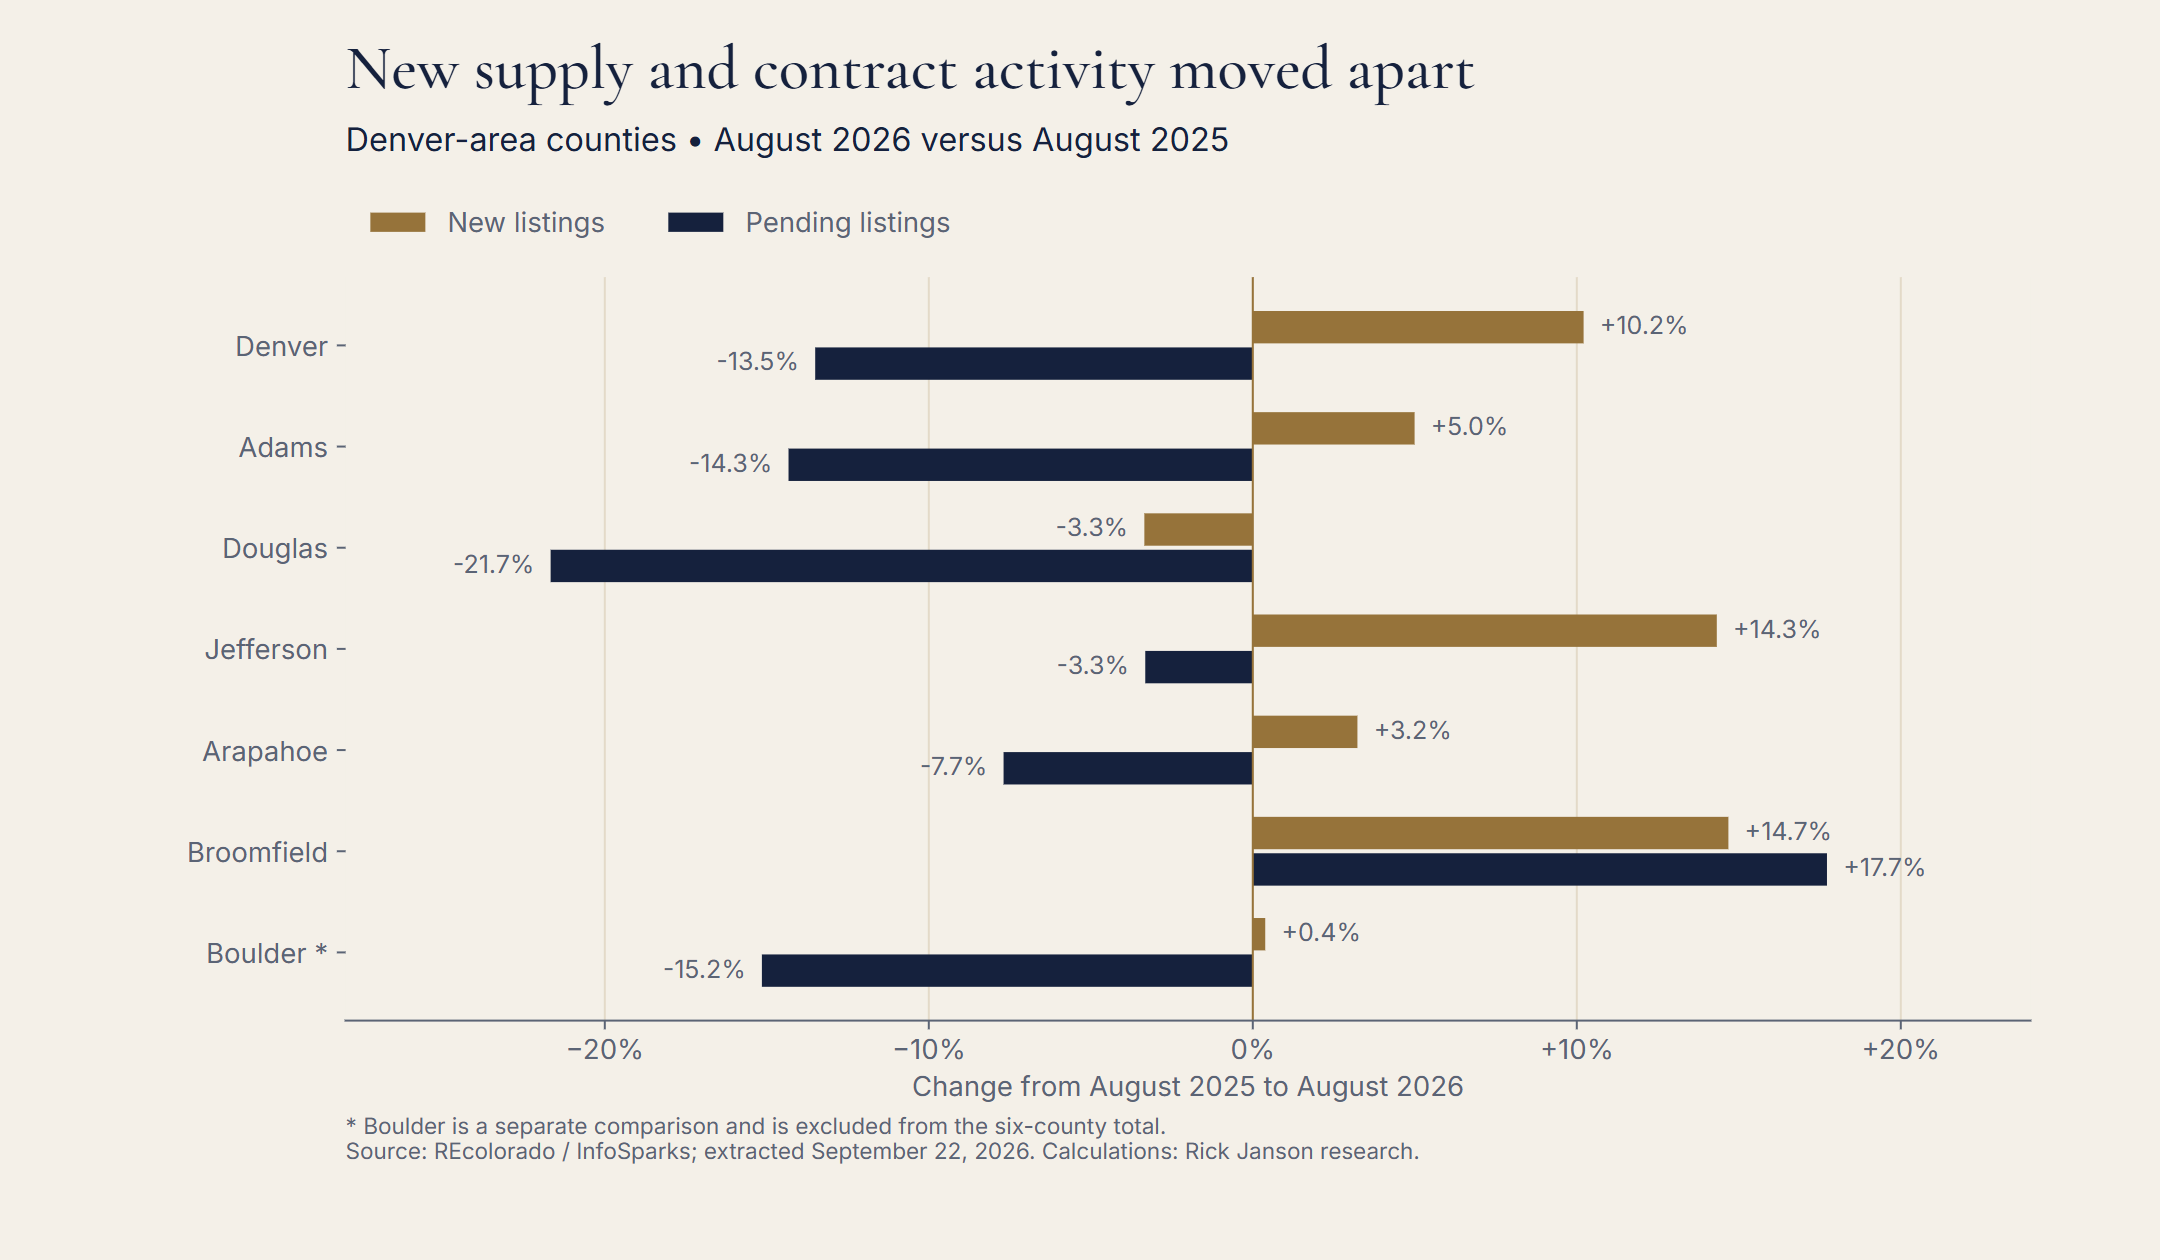
Boulder is a separate comparison and is excluded from every six-county total.
Douglas, Denver and Adams together accounted for 333 of the six-county area's 398 fewer pending listings, 83.7% of the net decline. This is an arithmetic contribution to the change, not evidence of why buyers acted differently.
Broomfield moved in the opposite direction. Its pending count rose from 79 to 93. That is 17.7% growth on a relatively small base, so the absolute increase of 14 matters alongside the percentage. Its June–August pending count also increased, by 13.0%, making it more than a single-month exception within this extract.
Was August an isolated slowdown?
The broader summer comparison points in the same direction. During June–August 2026, the six counties recorded 15,513 new listings and 9,932 pending listings. Relative to the same three months of 2025, new listings increased 3.3% and pending listings decreased 7.9%.
Pending activity equaled 64.0 listings per 100 new listings over those three months, compared with 71.8 a year earlier. Both ratios use the sums of the underlying counts, rather than an average of monthly or county ratios.
However, the year-to-date comparison is much less dramatic. From January through August, new listings fell 1.9% and pending listings fell 2.3%. The corresponding ratio was 67.3, versus 67.5 in 2025. During January–May, pending activity had actually increased 1.0% year over year; during June–August it fell 7.9%.
That makes the timing part of the finding: the latest summer interval weakened more than the year-to-date totals suggest. The evidence does not support describing the entire year as a continuous deterioration in this ratio.
How unusual was August's reading?
The August ratio was 75.5 in 2023, 72.7 in 2024, 79.5 in 2025 and 66.3 in 2026. This year's value was the lowest of the four August observations available in the downloaded history.
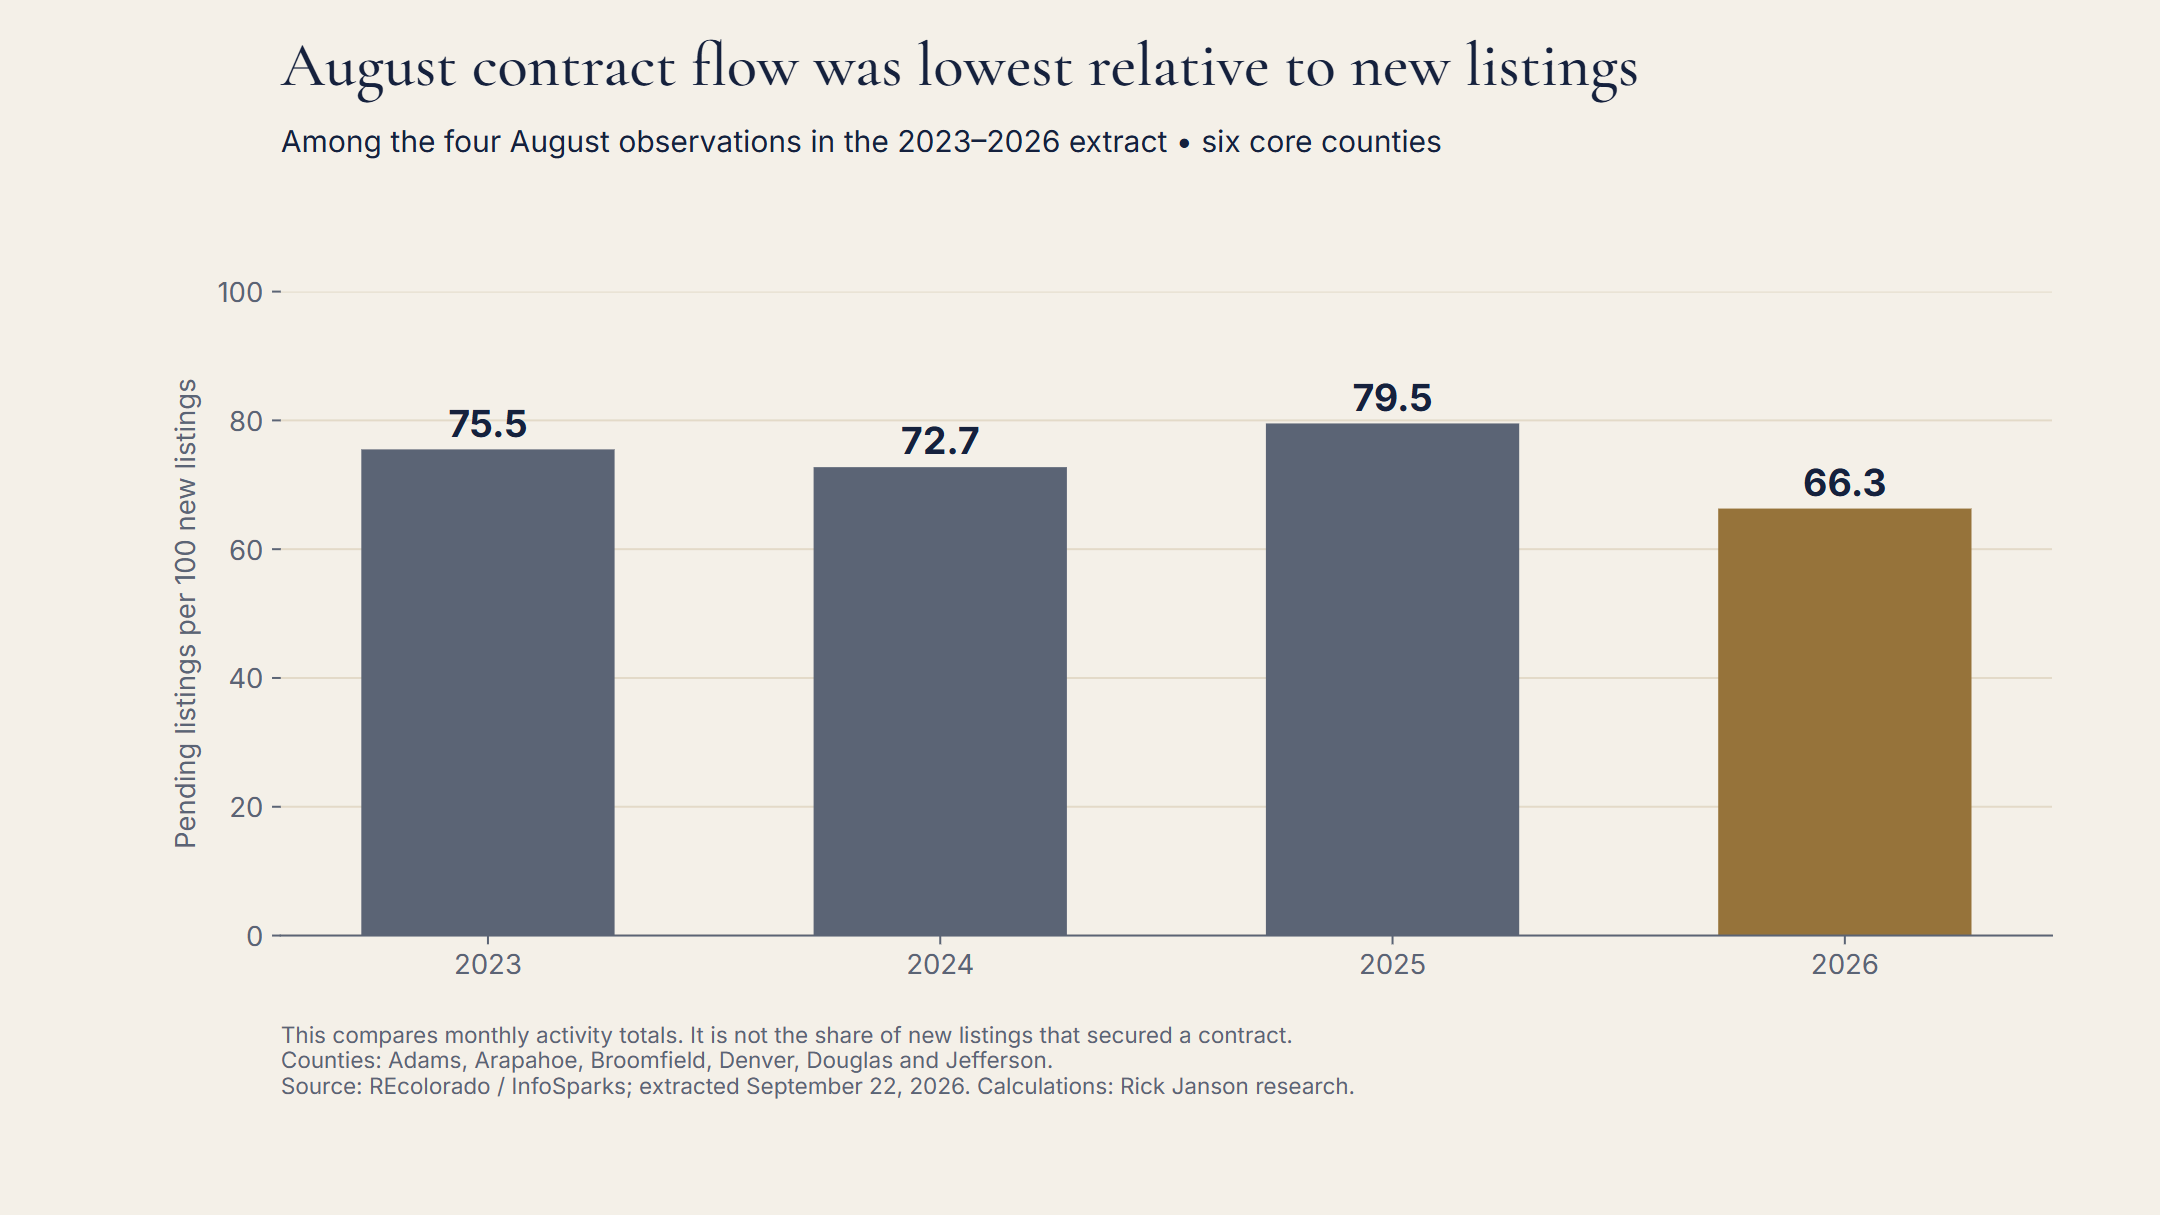
That is a same-calendar-month comparison, not an all-time low or a seasonally adjusted index. The source history begins in January 2023.
What does this mean for buyers and sellers?
For sellers, the practical question is how much relevant competition a home faces now and how quickly comparable properties are securing contracts. August's county totals are a reason to examine current competition carefully; they do not determine a property's asking price or justify a fixed percentage reduction.
For buyers, the data identify counties where contract activity weakened relative to new supply. They do not establish the discount a seller will accept. Condition, location, price band, property type and the seller's circumstances still require property-specific evidence.
Before making a pricing or offer decision, compare the home's actual neighborhood, property type and price range with recent competing listings and accepted contracts. This report combines all residential subtypes and prices, so it provides context rather than a valuation of any particular property.
Questions about the Denver Listing–Contract Gap
Does 66.3 mean 66.3% of new listings went under contract?
No. Some August contracts involved homes listed in earlier months. The numerator and denominator describe two separate monthly flows, not a matched set of properties. The measure is pending listings per 100 new listings; it is not a sale probability or a conversion rate.
Is Denver now a buyer's market?
This analysis does not apply a universal buyer's-market threshold. It shows weaker August contract activity relative to new supply across the six-county area, with different results by county. Month-end inventory was nearly unchanged from a year earlier, and Broomfield's contracts increased.
Is Boulder included in the Denver totals?
No. Boulder County appears only as a separate comparison. The core totals include Adams, Arapahoe, Broomfield, Denver, Douglas and Jefferson counties.
How was the research calculated?
The analysis uses monthly REcolorado / InfoSparks exports covering January 2023–August 2026, downloaded September 22, 2026. Twenty source files contain ten measures across two overlapping county groups. After the repeated Jefferson County values were checked and deduplicated, the dataset contained 3,080 unique county–metric–month observations. These are aggregate observations, not 3,080 home sales.
Only additive listing counts were combined across counties. Pending listings per 100 new listings equals pending listings divided by new listings, multiplied by 100. Year-over-year change compares the same calendar month or the same multi-month interval. No county medians were combined into a metro median.
The data do not establish causation, track cancellations, identify unique buyers, or adjust for changes in property mix. REcolorado coverage may not include every transaction in the market. InfoSparks can revise historical observations, so future extracts may differ from this dated edition.
Sources and research notes
- Market data: REcolorado / InfoSparks by ShowingTime Plus, Monthly CSV exports; all residential property subtypes and all price ranges.
- Metric definitions: REcolorado InfoSparks User Manual, reviewed September 22, 2026; login may be required.
- Public source context: REcolorado market trends.
- County comparison table, August history and matched-period calculations.
Suggested citation: Janson, Rick. “Denver Housing Market, August 2026: More Listings, Fewer Contracts.” Denver Listing–Contract Gap, August 2026 edition. REcolorado / InfoSparks data extracted September 22, 2026. Published September 22, 2026. https://www.rickjanson.com/research/denver-listing-contract-gap/2026-08/
Based on information from REcolorado®, Inc. for the period January 1, 2023 through August 31, 2026.
REcolorado statistical-publication policy, Section 12.0. Underlying MLS content remains subject to the source's rights and terms.
Talk it through
Need a property-specific comparison?
Compare current competition, recent contracts and the relevant price range for your situation.
Request a consultation