

August 2026 research edition
Denver Housing Inventory Is 88% Above 2023, but Flat Year Over Year

Published
Data through · Extracted
Denver-area housing inventory ended August 2026 at 12,686 active listings, up 88.2% from August 2023 but down 0.1% from August 2025. The total covers Adams, Arapahoe, Broomfield, Denver, Douglas and Jefferson counties. Jefferson had the largest percentage increase since 2023, at 119.0%. Arapahoe was the only core county with fewer active listings than a year earlier.
Both comparisons matter. Someone remembering the limited selection of August 2023 would encounter a substantially larger overall inventory today. Someone comparing this August with last August would see almost the same total. The supply rebuild is clear over three years; continued growth is not evident in the latest matched-August total.
How much has Denver-area inventory increased?
Across the six counties, month-end active listings increased from 6,741 in August 2023 to 12,686 in August 2026. That is a net increase of 5,945 active listings, or 88.2%.
The growth was concentrated in the first two annual comparisons:
Scroll horizontally to see all columns.
| August observation | Active listings | Change from previous August | Percent change |
|---|---|---|---|
| 2023 | 6,741 | Not available in this extract | Not available |
| 2024 | 10,338 | +3,597 | +53.4% |
| 2025 | 12,696 | +2,358 | +22.8% |
| 2026 | 12,686 | −10 | −0.1% |
Source for all figures: REcolorado / InfoSparks, Monthly Active Listings exports, extracted September 22, 2026. All residential subtypes and price ranges are included. Boulder County is reported separately and excluded from the six-county total.
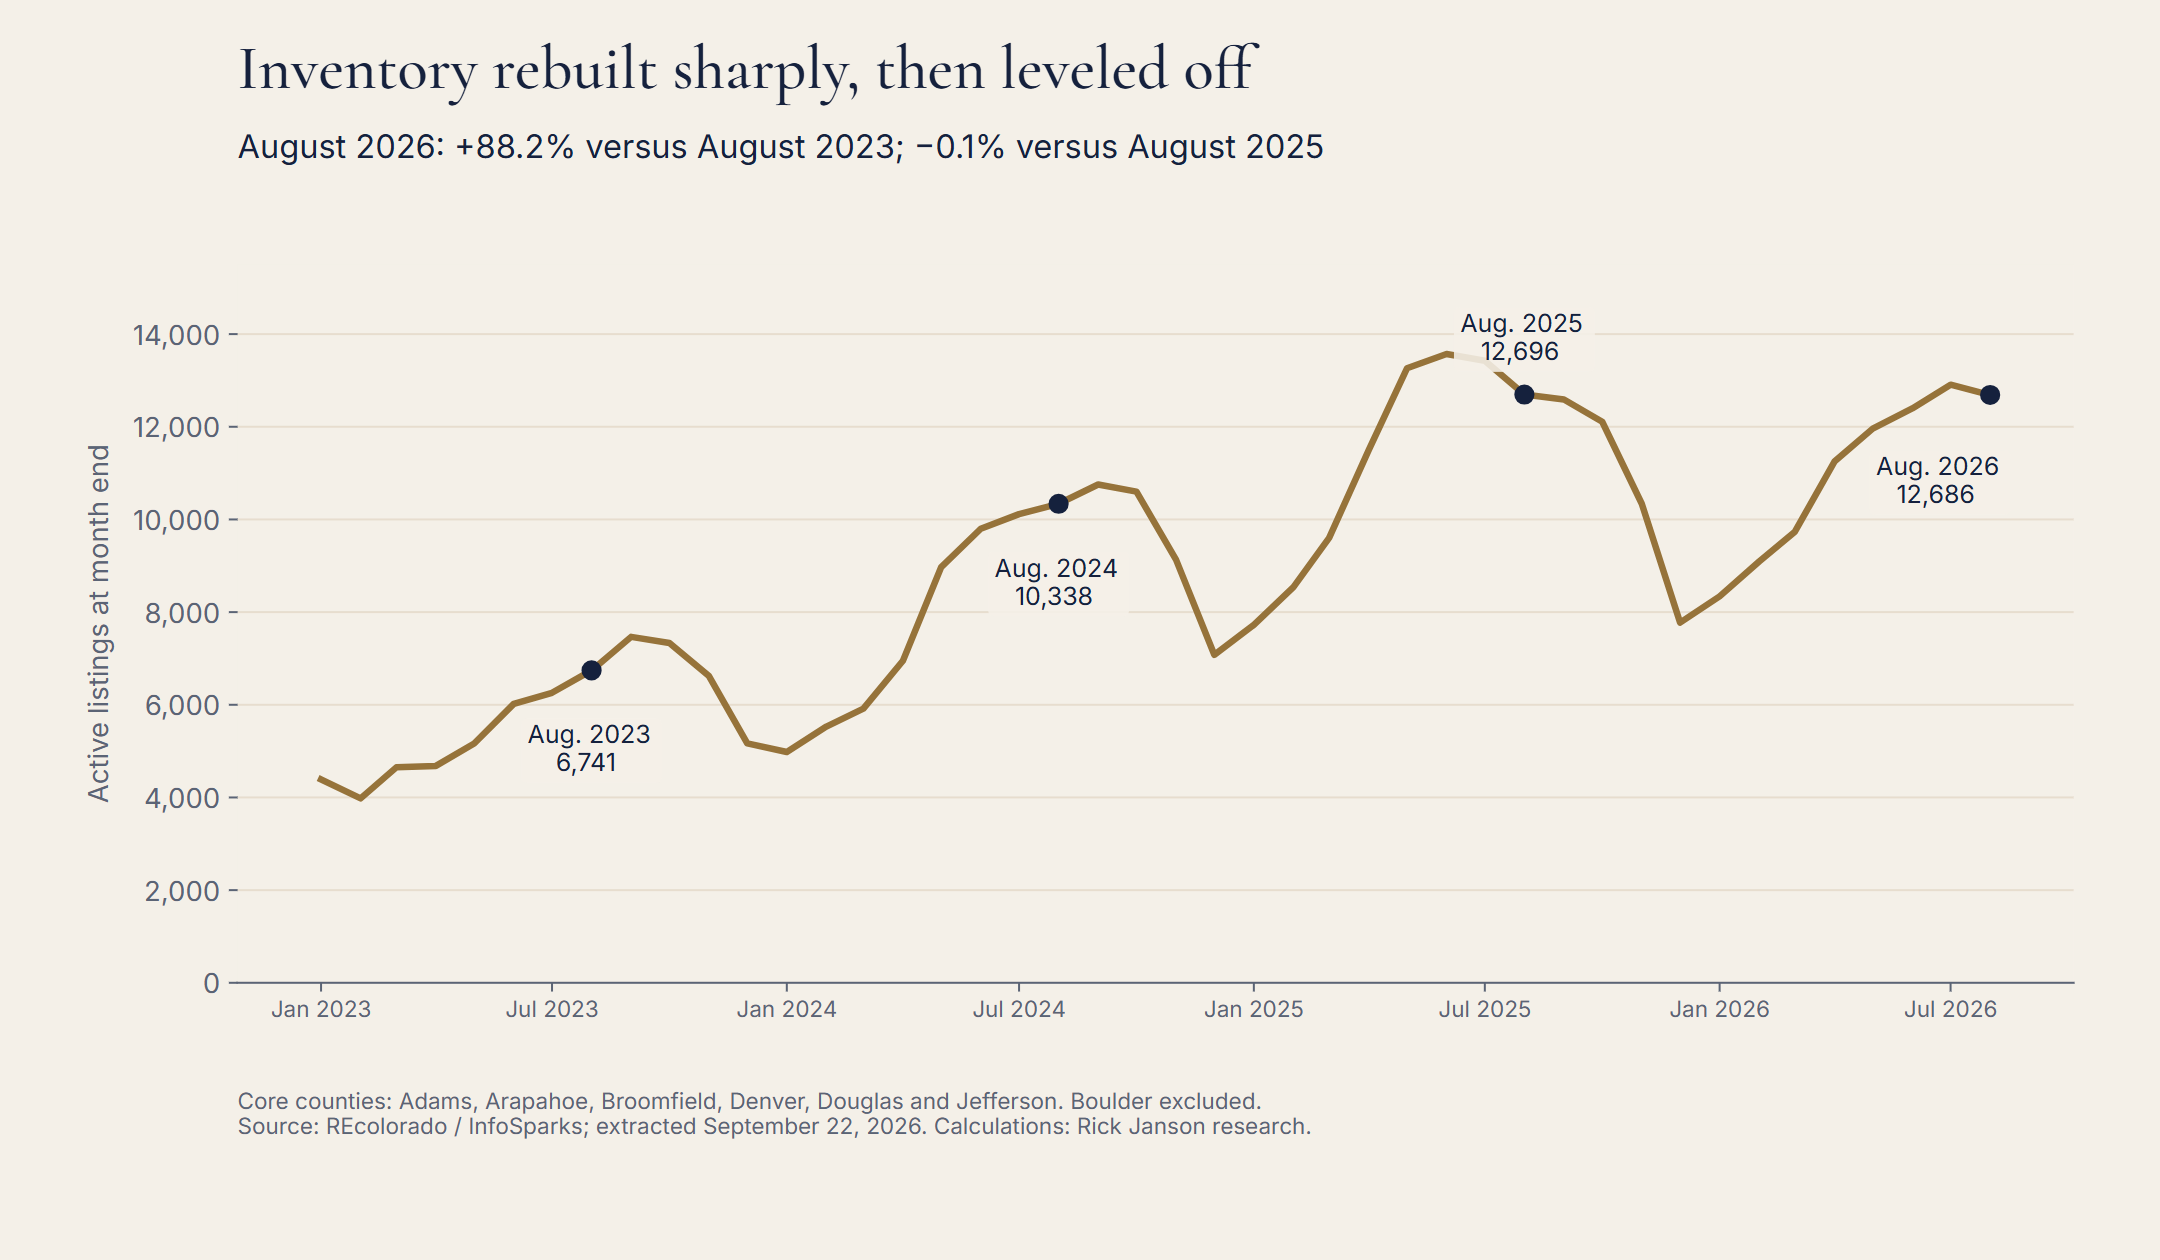
The 2023 comparison is a dated reference point, not a definition of normal inventory. These downloads begin in January 2023 and cannot establish whether supply has returned to a pre-pandemic level or a balanced market.
Which counties rebuilt inventory the most?
Jefferson County's August inventory rose from 1,049 listings in 2023 to 2,297 in 2026. Its 119.0% increase was the largest among the six core counties and the separately tracked Boulder comparison.
Denver County added the largest number of active listings: 1,559, rising from 1,797 to 3,356. That accounts for 26.2% of the six-county net increase since August 2023. Percentage growth and the number of additional listings answer different questions; a county can lead one measure without leading the other.
Scroll horizontally to see all columns.
| County | August 2023 active | August 2026 active | Change since 2023 | Change from August 2025 |
|---|---|---|---|---|
| Adams | 1,241 | 2,251 | +81.4% | +1.0% |
| Arapahoe | 1,362 | 2,526 | +85.5% | −4.3% |
| Broomfield | 168 | 296 | +76.2% | +0.7% |
| Denver | 1,797 | 3,356 | +86.8% | +1.3% |
| Douglas | 1,124 | 1,960 | +74.4% | +1.3% |
| Jefferson | 1,049 | 2,297 | +119.0% | +0.5% |
| Six-county total | 6,741 | 12,686 | +88.2% | −0.1% |
| Boulder, separate comparison | 973 | 1,497 | +53.9% | −5.4% |
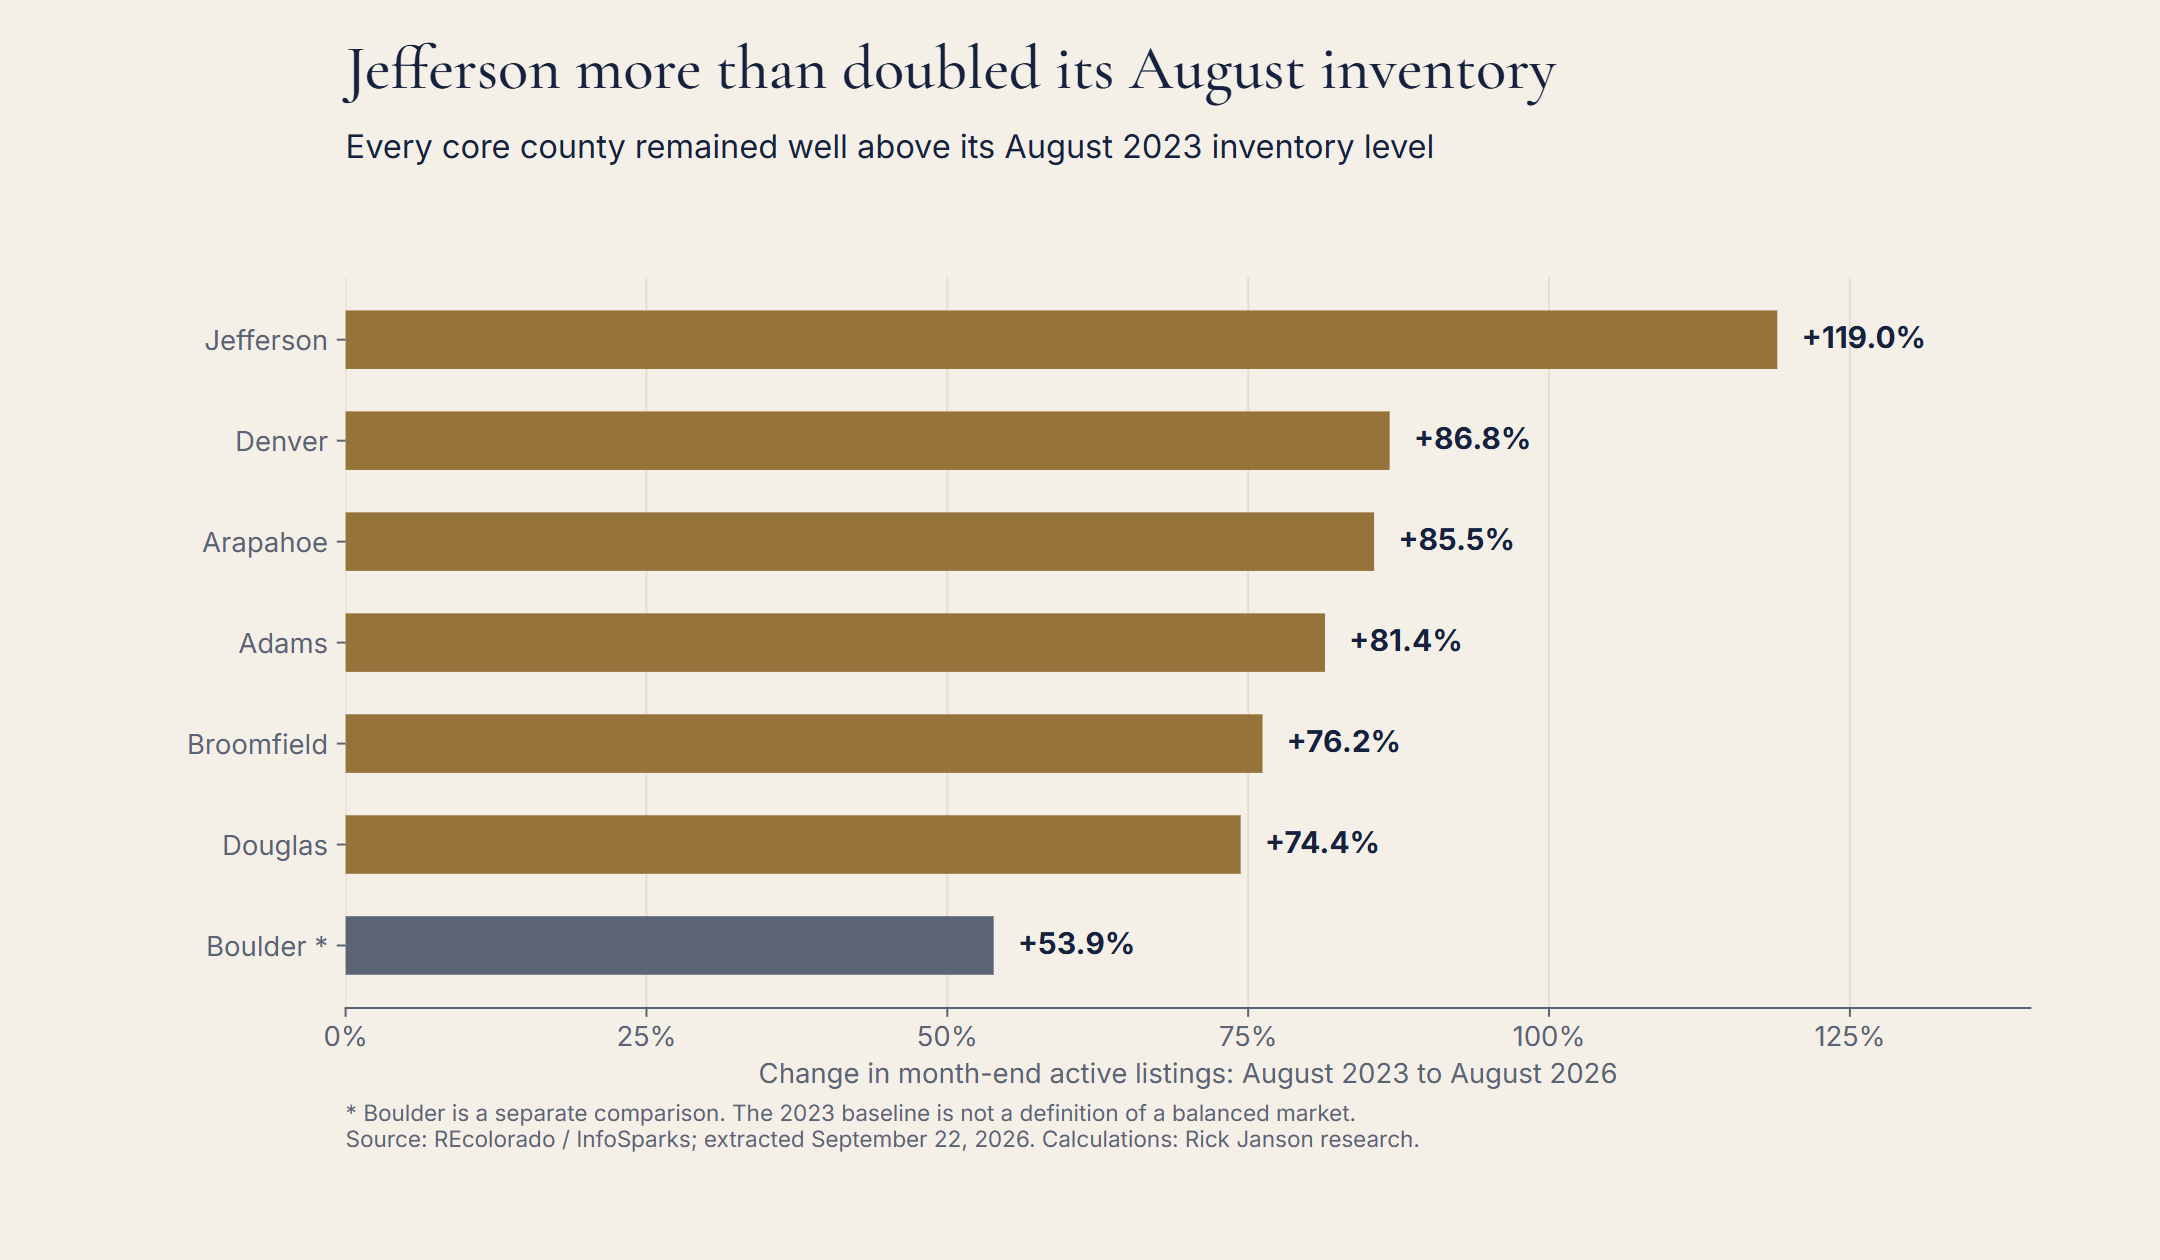
Every core county remained at least 74% above its August 2023 inventory. That is a broad geographic change in the overall stock of listings. It does not mean each neighborhood, price tier or property type offers 74% more suitable choices for a particular buyer.
Why was the six-county total flat if five counties gained inventory?
The county arithmetic explains the apparent contradiction. Compared with August 2025, active listings increased by 42 in Denver, 26 in Douglas, 22 in Adams, 11 in Jefferson and two in Broomfield. Those five gains totaled 103 listings.
Arapahoe's inventory declined by 113 listings, from 2,639 to 2,526. That more than offset the gains elsewhere, leaving the combined area down ten listings.
This identifies where the change occurred. It does not establish why Arapahoe inventory fell. These aggregate snapshots do not show whether individual properties sold, withdrew, expired or changed status for another reason.
Is inventory turning upward again?
The year-over-year comparison became less negative during the summer, but that does not mean inventory increased in August.
In May 2026, active inventory was 9.8% below May 2025. By August, the difference had narrowed to 0.1%. Two changes produced that result: the 2026 count rose from May to August, while the 2025 comparison count fell across those same calendar months.
Scroll horizontally to see all columns.
| Month | Active listings, 2025 | Active listings, 2026 | Year-over-year change |
|---|---|---|---|
| May | 13,263 | 11,960 | −9.8% |
| June | 13,571 | 12,396 | −8.7% |
| July | 13,426 | 12,908 | −3.9% |
| August | 12,696 | 12,686 | −0.1% |
From May to August, 2026 inventory increased by 726 listings; the 2025 comparison decreased by 567. Together, those movements narrowed the difference between years by 1,293 listings.
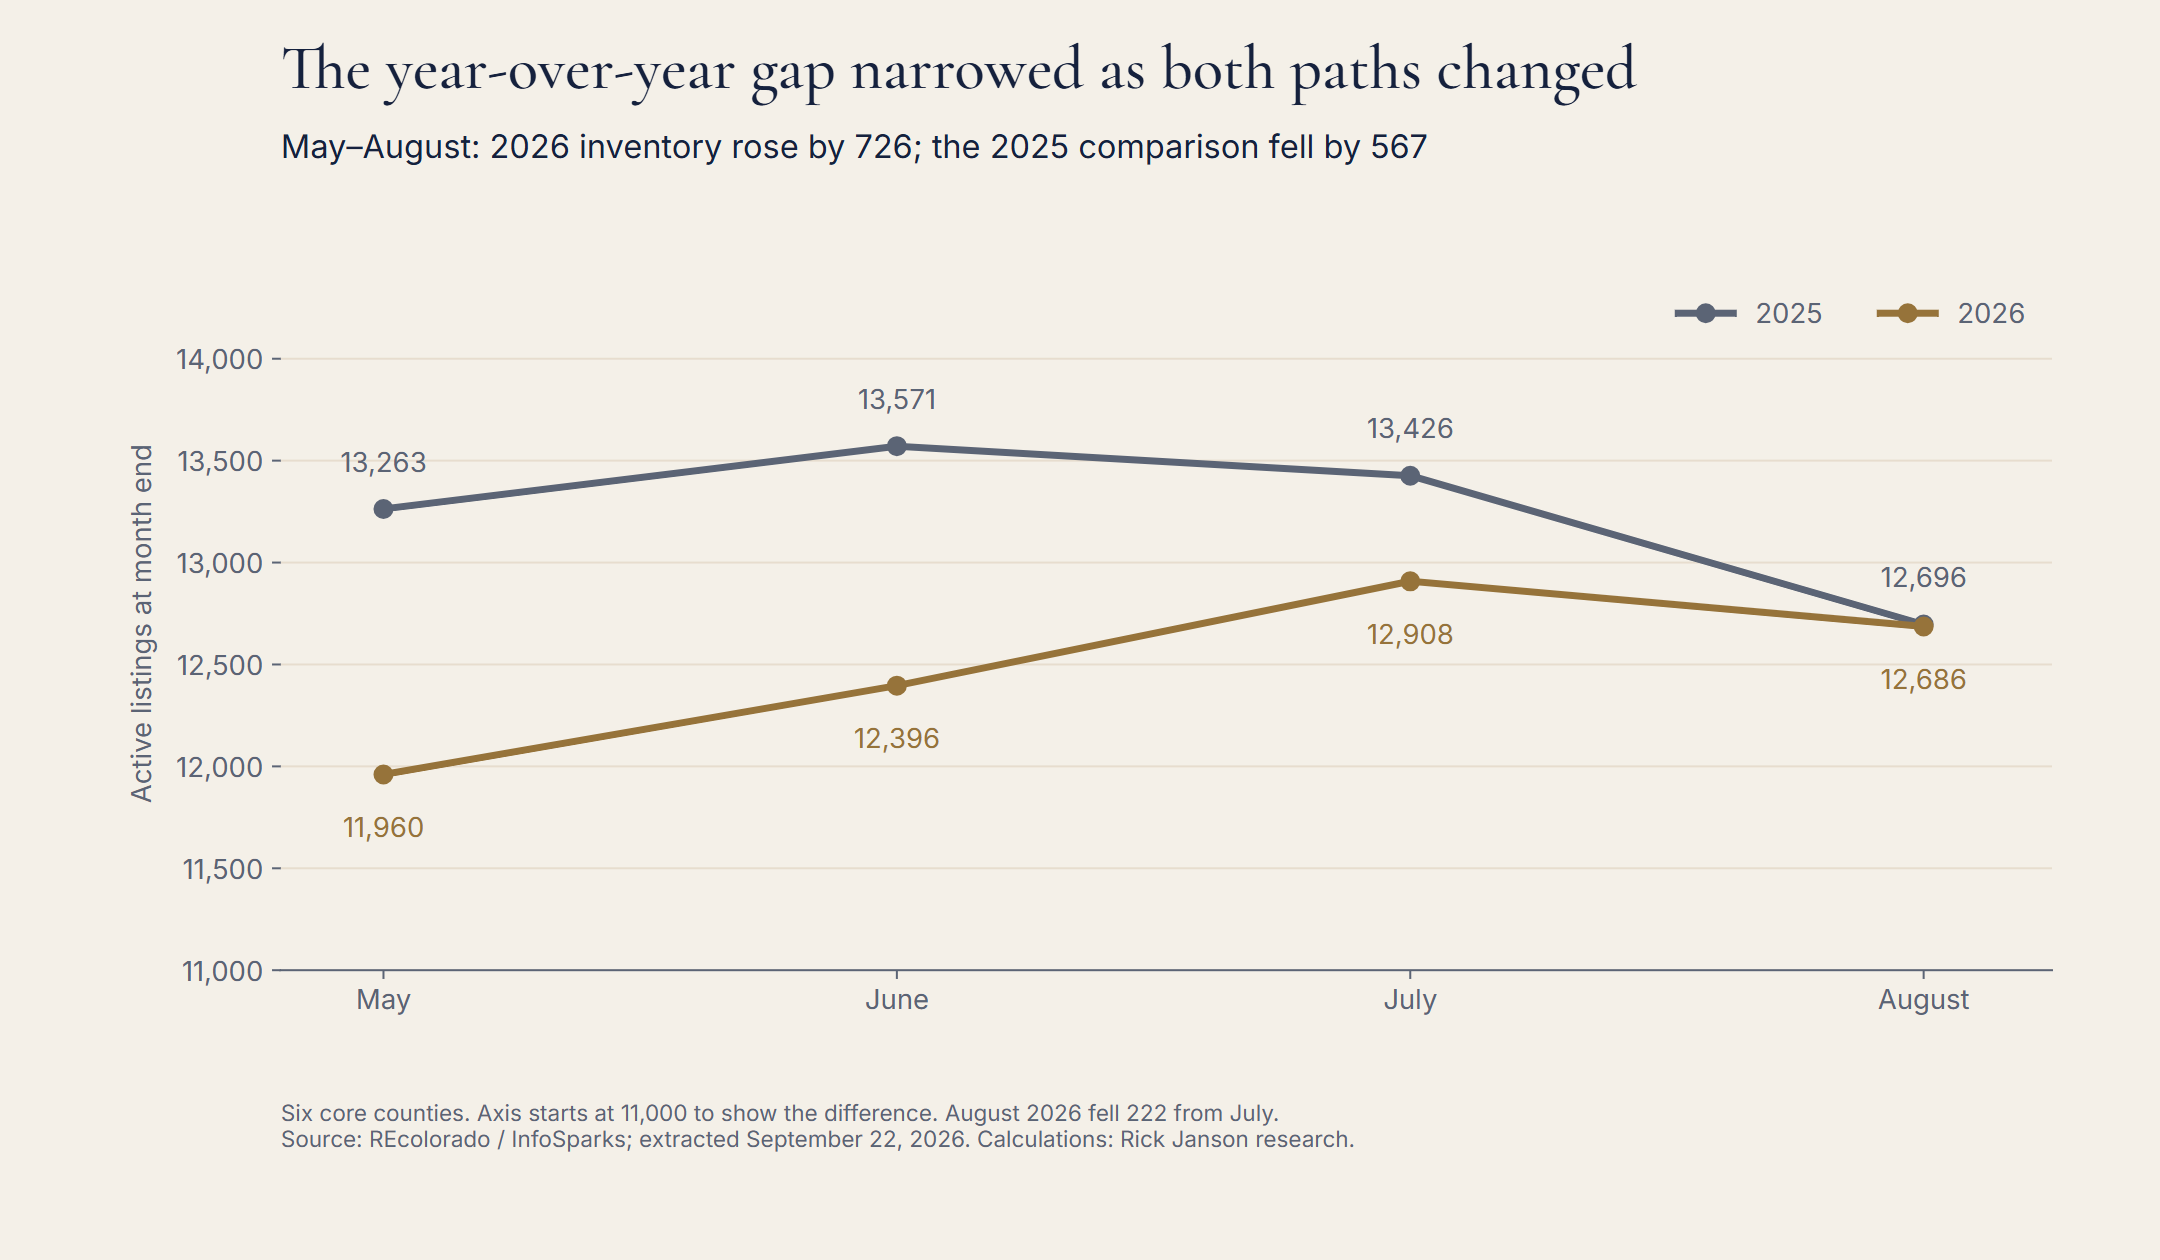
In the latest month alone, inventory fell by 222 listings, or 1.7%, from July to August 2026. Averaging the June, July and August month-end counts gives another useful check: summer 2026 inventory averaged 12,663 listings, 4.3% below the comparable 2025 average of 13,231.
The August total therefore caught up with last year's August level without exceeding the prior summer's average. A less negative year-over-year percentage should not be mistaken for a fresh month-to-month inventory surge.
How close is inventory to its recent peak?
The highest six-county month-end count in the available January 2023–August 2026 history was 13,571 in June 2025. August 2026 stood 885 listings, or 6.5%, below that observed peak.
Every individual county in this study also remained below its own highest monthly observation in the extract. Those county peaks occurred in different months. Adding the counties' separate peaks would create a total that did not necessarily exist at any one time, so the metro comparison uses the actual combined count for each month.
What should buyers and sellers take from this?
Buyers revisiting the market after several years have reason to reassess the available selection. The overall six-county inventory is substantially larger than in August 2023. Their useful search set, however, still depends on location, property type, price, condition and other property-specific requirements.
For sellers, the relevant comparison is today's competing inventory. The large three-year increase provides context, while the nearly flat annual comparison cautions against assuming competition is still expanding rapidly everywhere. Arapahoe's annual decline and Jefferson's much larger three-year increase demonstrate why the comparison period and county both matter.
Before using these numbers to price a home or negotiate an offer, narrow the analysis to comparable properties. This all-price, all-subtype inventory study does not establish a specific discount, predict prices or classify every local segment as a buyer's market.
For a companion view of new-listing and accepted-contract flows, see Denver Housing Market, August 2026: More Listings, Fewer Contracts. That research answers a different question from month-end inventory.
Questions about Denver housing inventory
What counts as an active listing?
InfoSparks defines active listings as properties available for sale in active status at the end of a month. This is a snapshot of inventory, not the number of homes newly listed during that month.
Does 88.2% growth mean almost 6,000 new homes were built?
No. The 5,945 figure is the difference between two month-end active-listing counts. It does not identify new construction, housing-stock growth or unique properties entering the market over three years.
Does “inventory recovery” mean the market is back to normal?
No. The series tracks inventory relative to explicit historical dates. It does not define a normal level, and this extract contains no pre-2023 observations.
Is Boulder included in these Denver-area totals?
No. The core totals include Adams, Arapahoe, Broomfield, Denver, Douglas and Jefferson counties. Boulder is a separate comparison. These boundaries define this research series, not an official metropolitan statistical area.
Methodology and sources
This analysis uses two unchanged REcolorado / InfoSparks Monthly Active Listings CSV exports covering January 2023–August 2026, downloaded September 22, 2026. The overlapping Jefferson County series was checked and deduplicated. The resulting inventory dataset contains 308 county-month observations across seven counties; these are aggregate observations, not 308 individual listings.
Counts are summed across mutually exclusive counties within the same month. Percent change equals the current count divided by the stated baseline count, minus one, multiplied by 100. The summer average is the arithmetic mean of three month-end inventories. It is not a count of distinct homes available during the summer. Percentages use unrounded values and are displayed to one decimal.
The analysis does not adjust for property mix or explain individual listing-status changes. REcolorado coverage may not include every property or transaction in the market, and InfoSparks can revise historical observations. This edition preserves the September 22, 2026 extract.
- County inventory comparison and observed peaks
- August historical totals
- May–August comparison data
- REcolorado market trends
- REcolorado InfoSparks manual, reviewed September 22, 2026; login may be required.
Suggested citation: Janson, Rick. “Denver Housing Inventory Is 88% Above 2023, but Flat Year Over Year.” Denver Inventory Recovery Tracker, August 2026 edition. REcolorado / InfoSparks data extracted September 22, 2026. Published September 22, 2026. https://www.rickjanson.com/research/denver-inventory-recovery/2026-08/
Based on information from REcolorado®, Inc. for the period January 1, 2023 through August 31, 2026.
REcolorado statistical-publication policy, Section 12.0. Underlying MLS content remains subject to the source's rights and terms.
Talk it through
Need a property-specific comparison?
Compare current competition, recent contracts and the relevant price range for your situation.
Request a consultation