

August 2026 research edition
Denver Homes Sell Near Asking Even as Four County Price Medians Fall

Published
Data through ; extracted .
Denver-area county median closing-to-list ratios ranged from 98.8% to 100.0% in August 2026. Yet four of the six core counties had lower median sale prices than a year earlier while their closing-to-list ratios held steady or increased. Adams County made the distinction especially clear: its reported median ratio was 100.0% in every month from January through August 2026, and its median sale price was below the matching 2025 month each time.
These findings come from an original comparison of REcolorado / InfoSparks monthly county aggregates. The six-county research area includes Adams, Arapahoe, Broomfield, Denver, Douglas and Jefferson. Boulder County is shown separately. The analysis covers all residential property subtypes and price ranges in the exports.
The finding matters when interpreting a familiar housing headline: homes are selling “near asking.” That describes the relationship between a closing price and a recorded list price. By itself, it does not establish rising property values, a lack of earlier price reductions, or the seller's proceeds after concessions.
Are Denver-area homes selling at asking price?
The August 2026 county medians were close to asking, but the figures varied by county. Adams and Broomfield reported 100.0%. Arapahoe reported 99.7%, Jefferson 99.3%, Douglas 99.2% and Denver 98.8%. These are separate county medians; this study does not calculate a combined metro median.
Scroll horizontally to see all columns.
| County | Aug. 2025 ratio | Aug. 2026 ratio | Ratio change | Aug. 2026 median price | Median-price change |
|---|---|---|---|---|---|
| Adams | 100.0% | 100.0% | 0.0 pp | $489,950 | -2.0% |
| Arapahoe | 99.9% | 99.7% | -0.2 pp | $525,500 | +3.0% |
| Broomfield | 99.0% | 100.0% | +1.0 pp | $610,000 | -0.8% |
| Denver | 98.8% | 98.8% | 0.0 pp | $575,000 | -1.7% |
| Douglas | 99.1% | 99.2% | +0.1 pp | $717,500 | +4.0% |
| Jefferson | 99.2% | 99.3% | +0.1 pp | $630,000 | -3.1% |
| Boulder (separate) | 98.5% | 98.8% | +0.3 pp | $700,000 | -6.1% |
Ratio means the source-reported median of individual closing-price/list-price ratios. Price change compares August 2026 with August 2025. “pp” means percentage points. Boulder is outside the six-county core.
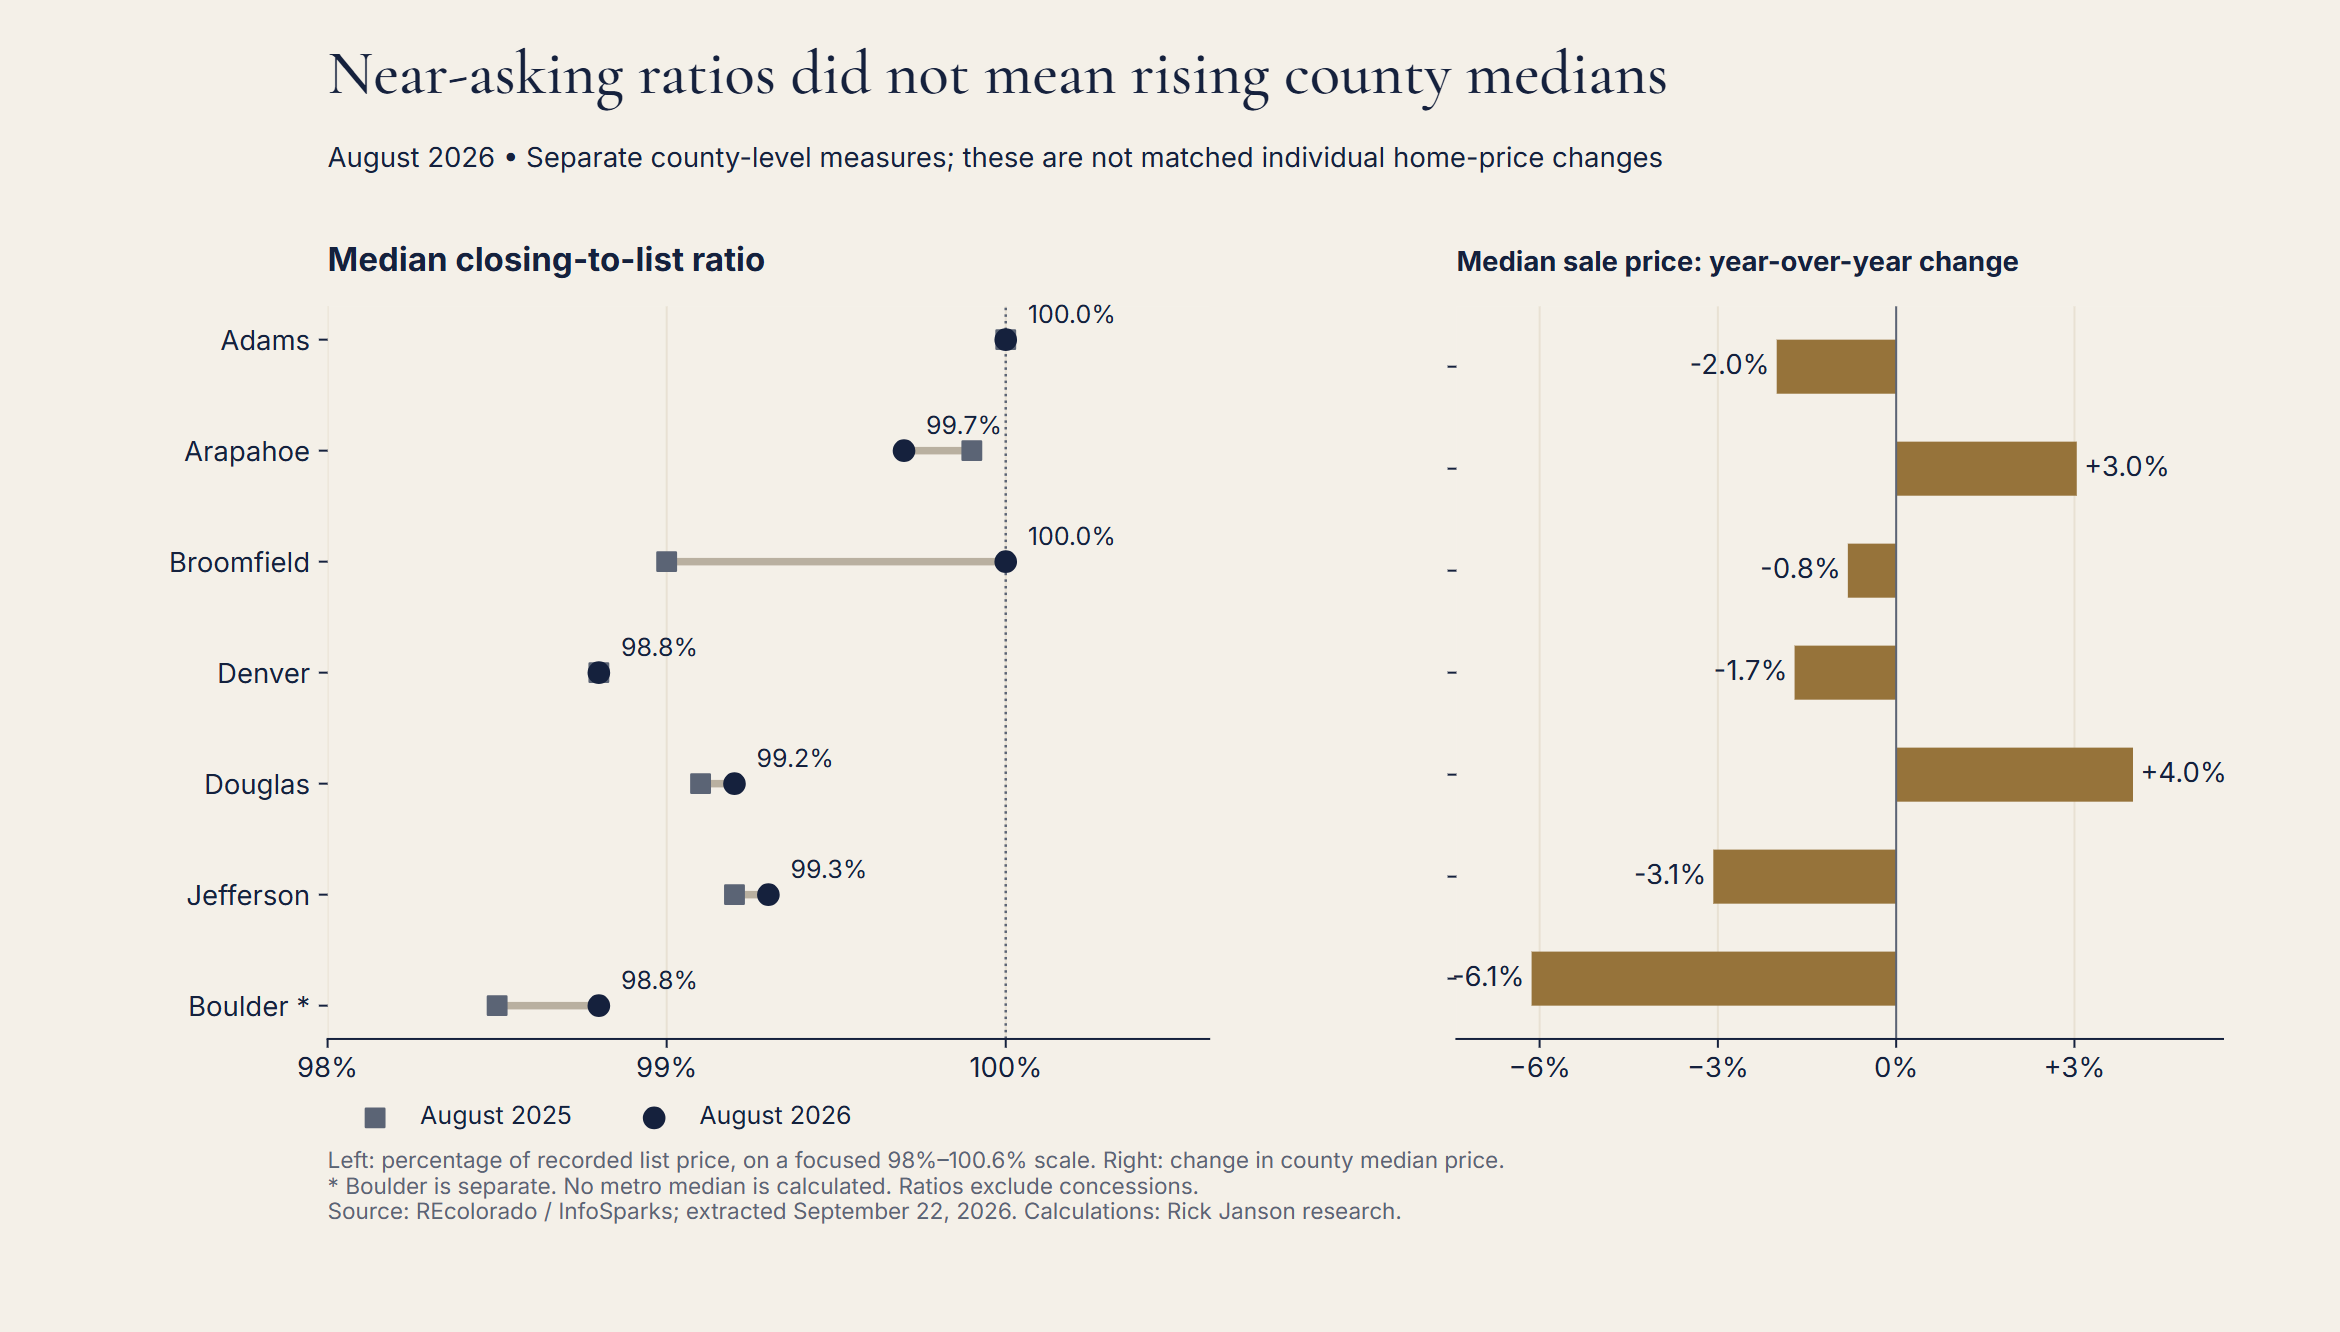
The ratio chart uses a focused scale to show small differences near 100%. The price chart measures changes in county medians, not changes in the value of individual homes. Source: REcolorado / InfoSparks; calculations by Rick Janson research.
The four core counties with lower median prices and unchanged or higher ratios were Adams, Broomfield, Denver and Jefferson. Broomfield's ratio increased from 99.0% to 100.0%, even as its median price declined from $615,000 to $610,000. Jefferson's ratio edged up from 99.2% to 99.3%, while its median price fell from $650,000 to $630,000.
Arapahoe showed the reverse combination: its ratio decreased from 99.9% to 99.7%, while its median price increased from $510,000 to $525,500. Douglas had both a higher ratio and a higher median price. These different combinations show why one measure cannot substitute for the other.
Boulder, the separate comparison county, also had a higher ratio and a lower median price. Its ratio rose 0.3 percentage points to 98.8%; its median price declined 6.1% to $700,000.
Adams County reported a 100% median ratio for eight straight months
Adams County's pattern extends beyond one month's comparison. Its reported monthly median closing-to-list ratio was 100.0% in all eight months from January through August 2026. In each of those months, the county's median closed price was lower than in the same month of 2025.
Scroll horizontally to see all columns.
| 2026 month | Reported median ratio | 2025 median price | 2026 median price | Annual price change |
|---|---|---|---|---|
| January | 100.0% | $499,990 | $479,000 | -4.2% |
| February | 100.0% | $510,000 | $500,000 | -2.0% |
| March | 100.0% | $514,975 | $500,000 | -2.9% |
| April | 100.0% | $507,000 | $487,000 | -3.9% |
| May | 100.0% | $510,000 | $496,778 | -2.6% |
| June | 100.0% | $510,000 | $496,750 | -2.6% |
| July | 100.0% | $505,000 | $480,000 | -5.0% |
| August | 100.0% | $500,000 | $489,950 | -2.0% |
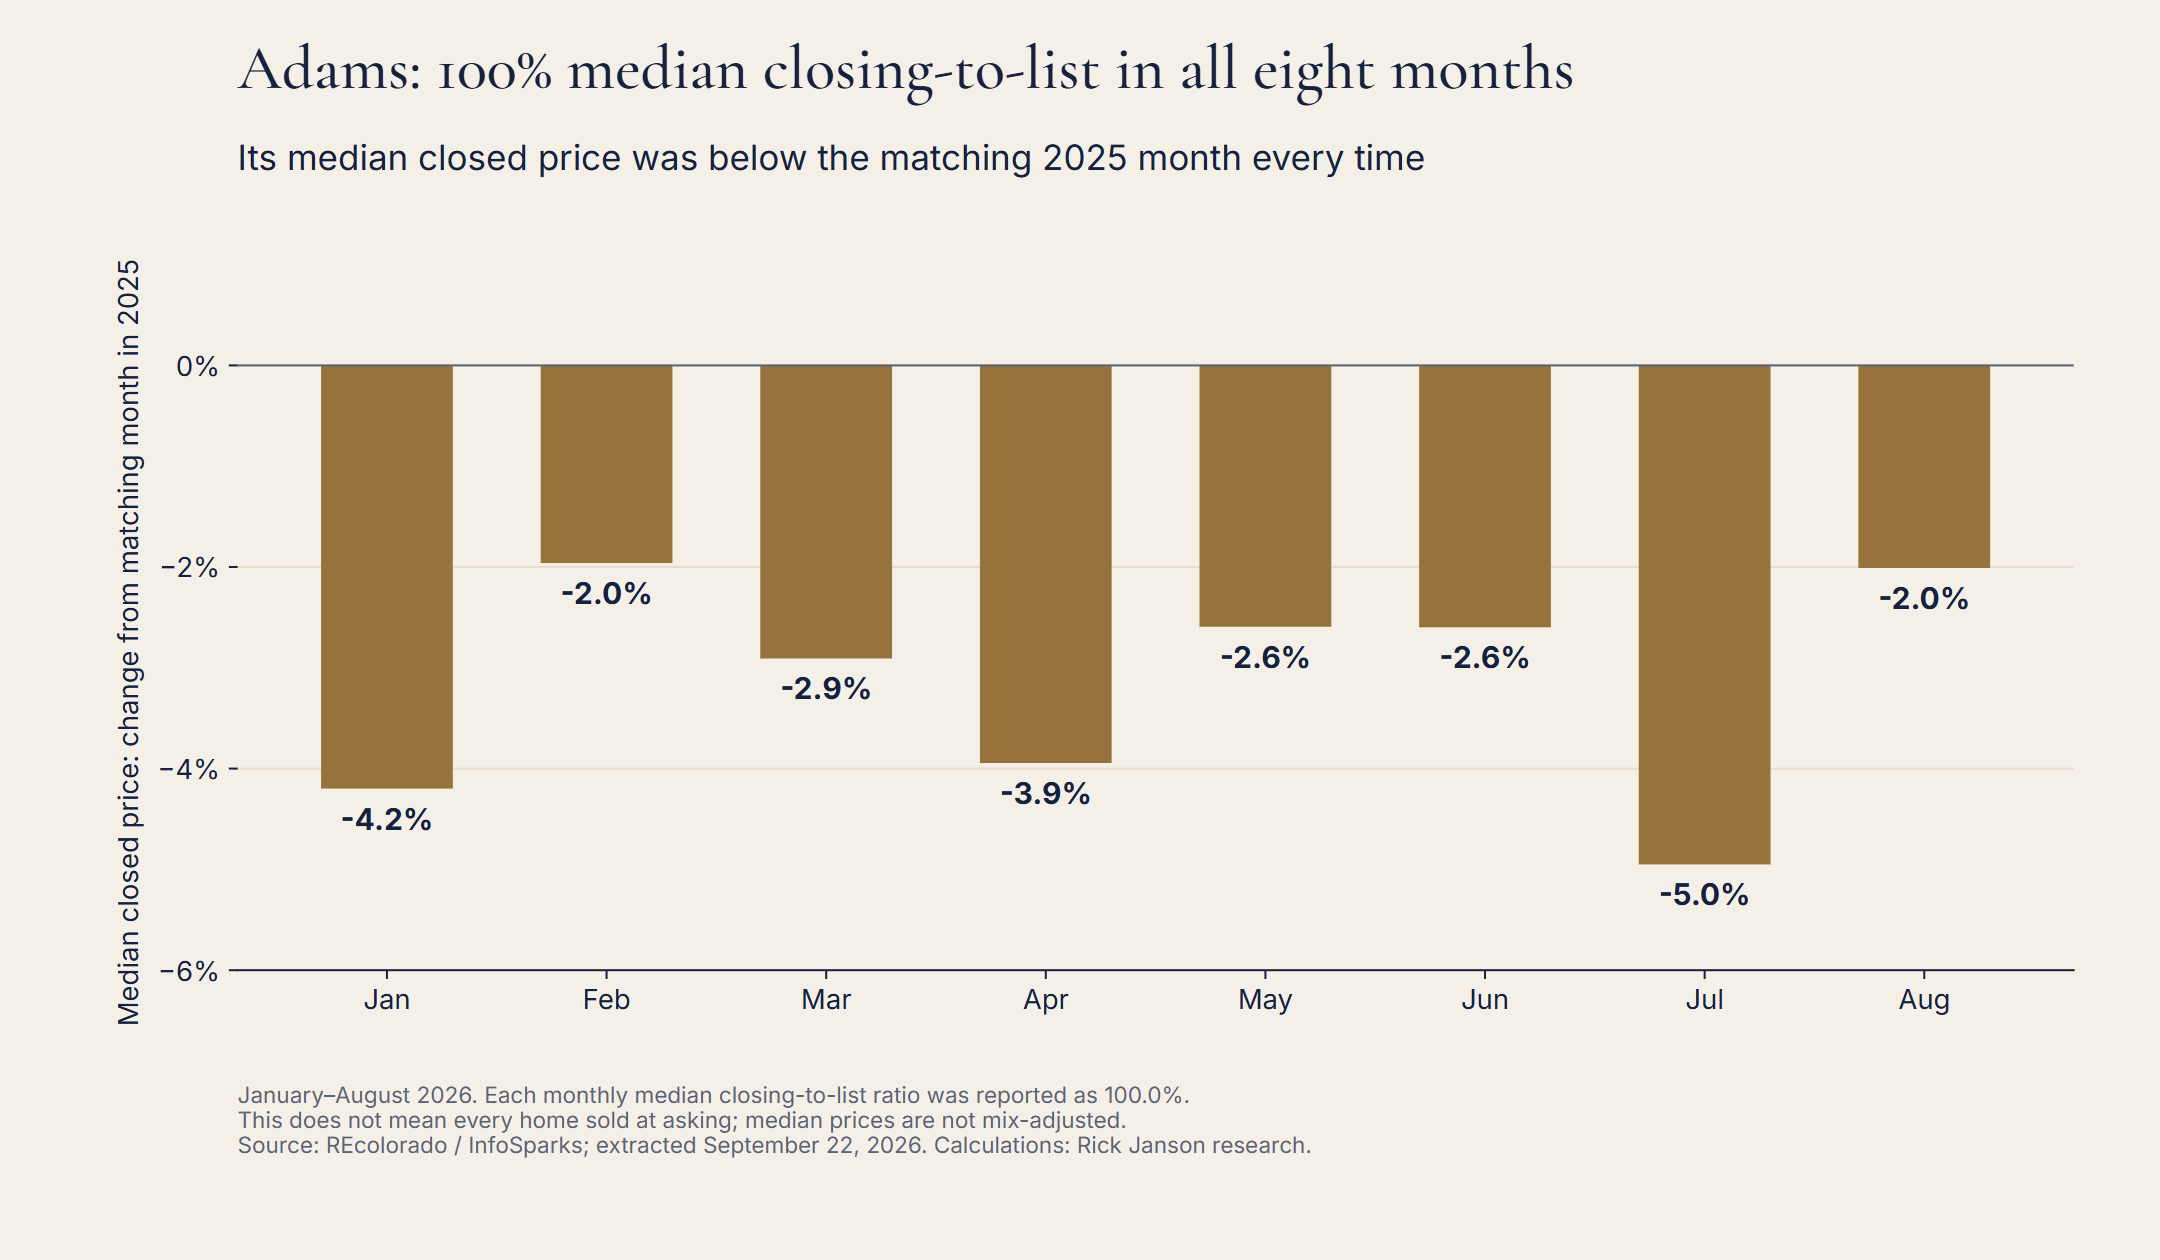
Annual changes are calculated from separate monthly median closed prices. The eight monthly ratios are not a pooled January–August ratio.
July had the largest annual median-price decline in this eight-month comparison, at 5.0% after rounding. August's median was $489,950, down 2.0% from $500,000 a year earlier.
This is a pattern in monthly county aggregates. It does not mean every Adams home sold at asking, nor does it establish that an individual property lost value. Different homes sold in the two years, and the exports do not control for changes in property type, size, condition, neighborhood or price tier.
Does “100% of asking” include earlier price cuts?
A closing-to-list ratio can reflect the asking price after earlier reductions. The InfoSparks manual's explanation uses the list price on the relevant listing after changes, rather than the property's first asking price. These exports provide the resulting county median ratio, not each home's original asking price or price history.
Consider a hypothetical example, not an observed MLS record. A seller first asks $650,000, lowers the asking price to $600,000, and closes at $600,000. The sale equals 100% of the revised asking price, but about 92.3% of the original asking price. Both calculations can be correct because their denominators differ.
The county data cannot tell us how many sellers followed that path. It also cannot separate price reductions from differences in the homes that happened to sell. The defensible finding is that near-asking ratios coexisted with lower county median prices; the causes require more detailed records.
Seller concessions are another missing part of the picture. InfoSparks' closing-price and closing-to-list measures do not adjust for concessions. A ratio near 100% therefore does not show what a seller retained after credits, transaction costs or other negotiated terms.
Did near-asking prices mean quick sales?
The separate median Days in MLS series adds context. Every core county reported a longer median in August 2026 than in August 2023. Five of the six had at least twice their August 2023 median. At the same time, all six were faster than August 2025.
Scroll horizontally to see all columns.
| Core county | Aug. 2023 days | Aug. 2025 days | Aug. 2026 days |
|---|---|---|---|
| Adams | 14 | 32 | 31 |
| Arapahoe | 9 | 28 | 27 |
| Broomfield | 12 | 22 | 20 |
| Denver | 11 | 34 | 28 |
| Douglas | 15 | 35 | 32 |
| Jefferson | 9 | 25 | 20 |
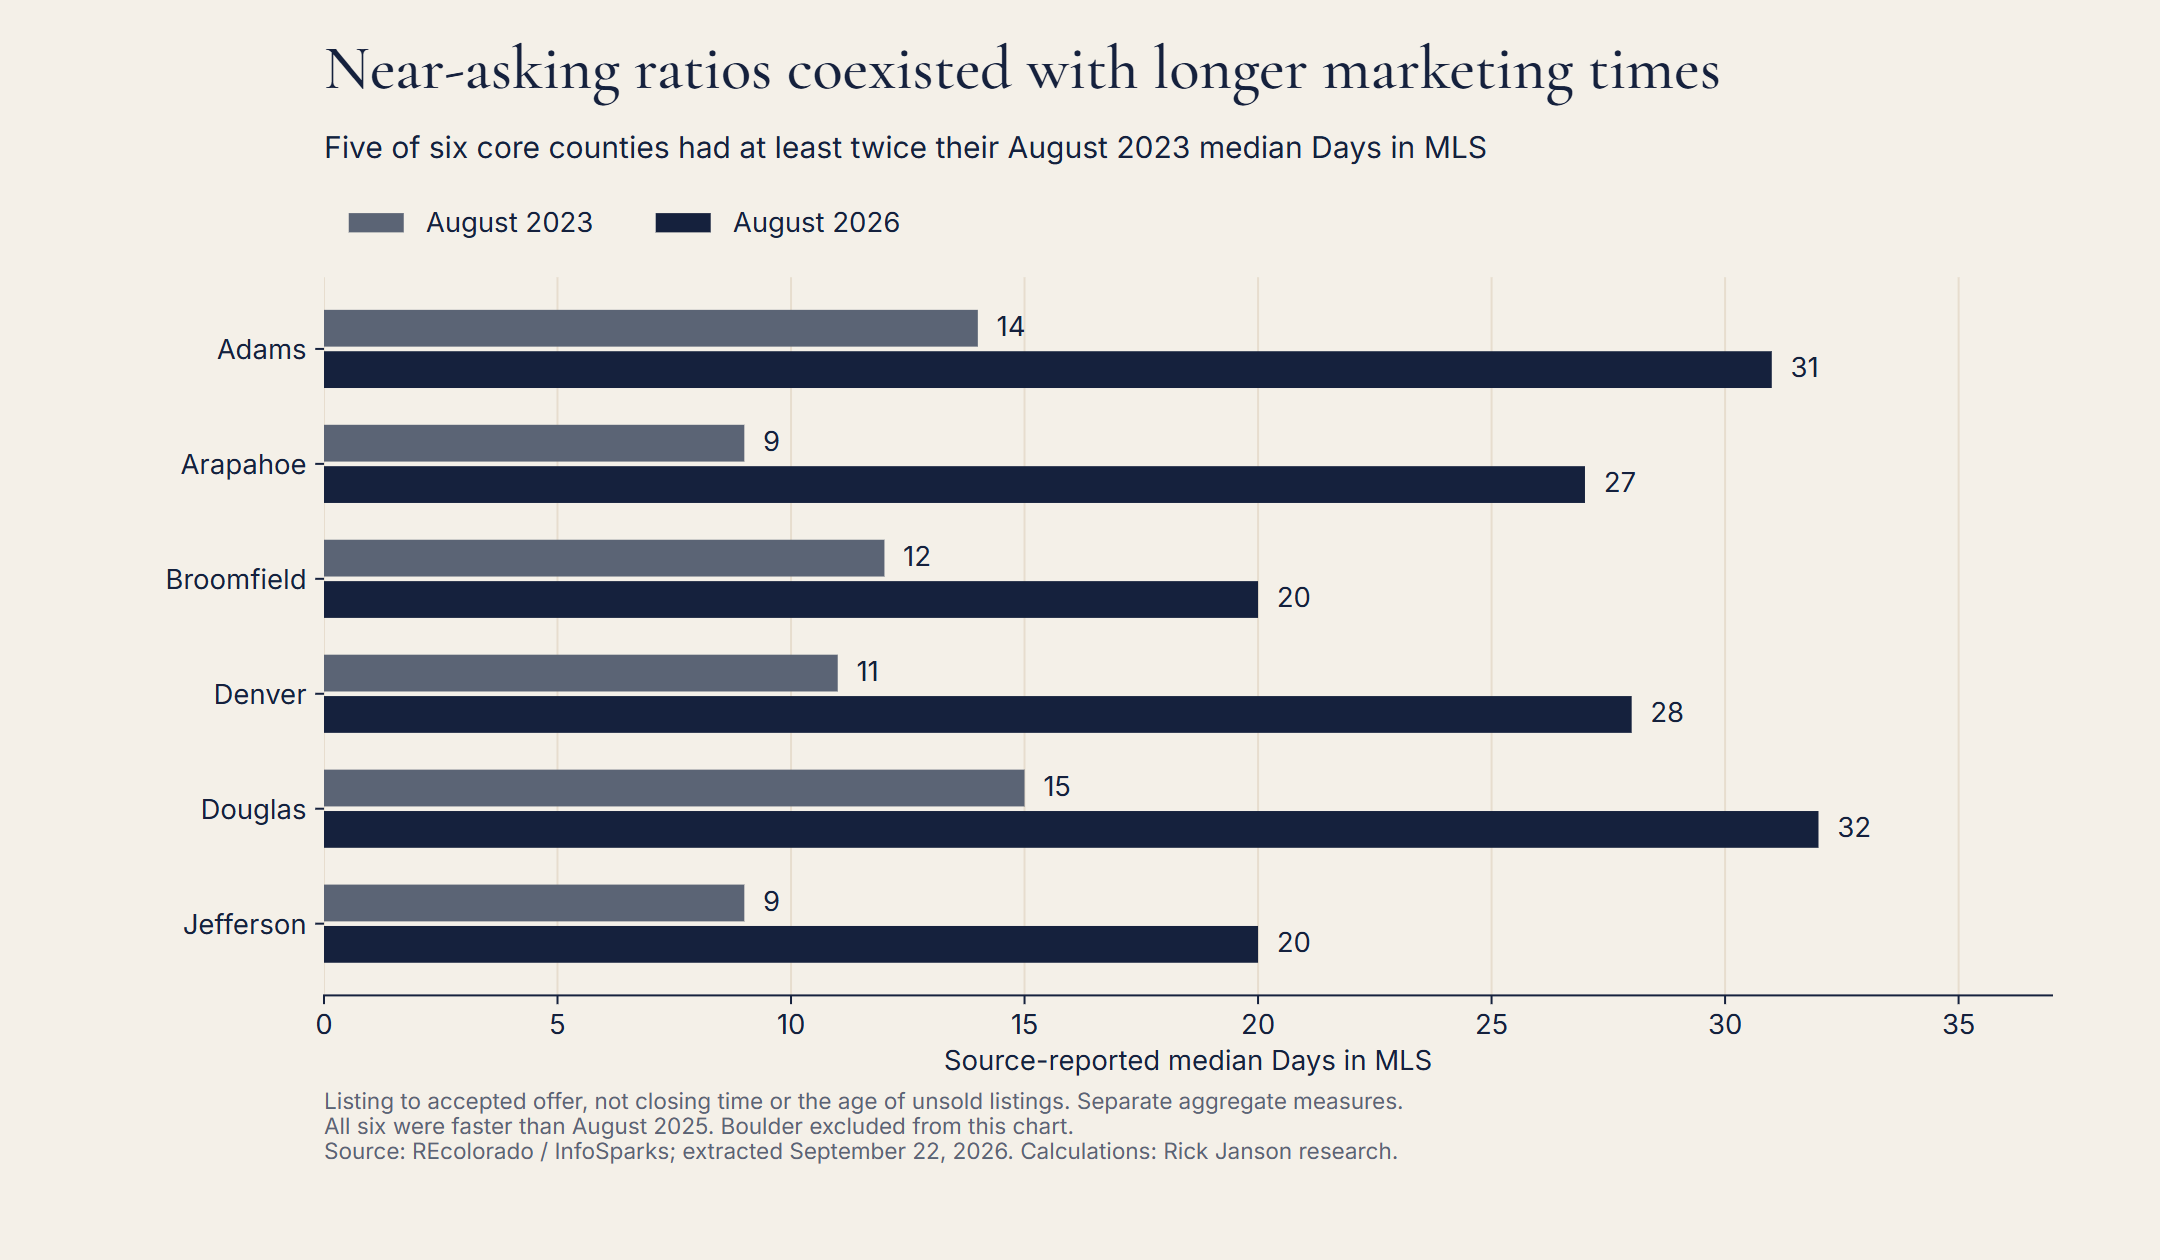
InfoSparks defines Days in MLS as time from listing to accepted offer. It is not time to closing or the age of currently unsold inventory. This is a separate aggregate series, not a matched analysis of the individual sales behind the ratios.
For example, Denver reported a 98.8% median ratio in August 2026 alongside 28 median Days in MLS. Its days figure was lower than August 2025's 34 but higher than August 2023's 11. The choice of comparison year changes the timing story without changing the August 2026 ratio.
How should buyers and sellers use these findings?
For buyers, a county ratio is a starting point for questions about a specific home. Its asking-price history, comparable sales and concession terms are needed to understand the negotiation. A county median cannot determine an appropriate offer on its own.
For sellers, an eventual sale close to the recorded asking price does not reveal the price changes or marketing time that preceded it. A property-specific review should connect the initial asking price, subsequent changes, accepted offer and concessions. The county data provides background, while the individual listing provides that sequence.
The study's practical contribution is to put three different measures side by side: closing price relative to asking, the level of county sale prices, and marketing time. Each answers a different question. For related local evidence, see Denver Housing Market, August 2026: More Listings, Fewer Contracts and Denver Housing Inventory Is 88% Above 2023, but Flat Year Over Year.
Common questions about Denver sale-to-list ratios
Does a 100% median ratio mean every home sold at asking?
No. It is a reported middle value of individual ratios, subject to source rounding. It does not disclose the share of homes that sold at, above or below asking.
Do lower county median prices prove home values declined?
No. A county median compares the middle prices of different groups of sales. Changes in the mix of homes sold can affect it. This study is not a repeat-sales or property-value index.
What was Denver County's closing-to-list ratio in August 2026?
Denver County reported 98.8%, unchanged from August 2025. Its median closed price was $575,000, down 1.7% from $585,000. Denver County is one county in this study, not the whole metro area.
Can these figures measure seller concessions or original-price discounts?
No. Concessions are excluded from the source's price measures, and original asking prices and listing histories are absent from these aggregate exports.
Methodology and downloadable evidence
This study uses eight monthly CSV exports covering four measures: median closing-to-list ratio, median closed price, median Days in MLS and closed-listing count. The exports cover January 2023 through August 2026 across seven counties, producing 1,232 unique county-month-metric observations. All 176 overlapping Jefferson County observations matched and were deduplicated.
The core six counties are a defined research geography, not an official metropolitan statistical area. Boulder is a separate comparison. No county medians are averaged or weighted to create a metro median, and no monthly medians are combined into a year-to-date median. All year-over-year price changes compare matching calendar months; they are not seasonally adjusted.
Closed-listing counts provide volume context. Broomfield had 92 reported closings in August 2026, compared with 69 in August 2025; the other core counties had between 554 and 652 in August 2026. These totals are not verified sample sizes for each median, because source exclusions can differ by metric. No statistical-significance or causal claim is made.
Source rounding limits the precision of ratio comparisons. Figures are the September 22, 2026 extraction vintage; later MLS revisions may change historical values.
- County comparison and closing counts (CSV)
- Adams County monthly comparisons (CSV)
- August county history, 2023–2026 (CSV)
- InfoSparks metric definitions — login may be required.
- REcolorado market trends
Suggested citation: Janson, Rick. “Denver Homes Sell Near Asking Even as Four County Price Medians Fall.” Denver Closing-Price Report, No. 3, August 2026 edition. Calculations from REcolorado / InfoSparks monthly county exports, extracted September 22, 2026. Published September 22, 2026. https://www.rickjanson.com/research/denver-closing-price-vs-asking/2026-08/.
Based on information from REcolorado®, Inc. for the period January 1, 2023 through August 31, 2026.
REcolorado statistical-publication policy, Section 12.0. Underlying MLS content remains subject to the source's rights and terms.
Talk it through
Need a property-specific comparison?
Review your home's asking-price history, comparable sales and current competition.
Request a review of your home's asking-price history and comparable sales