

August 2026 research edition
Fewer Contracts, Shorter Marketing Times in Five Denver-Area Counties

Published
Data through ; extracted .
Five of six core Denver-area counties recorded fewer accepted contracts and shorter median Days in MLS in August 2026 than a year earlier. Across the core, accepted-contract activity fell 11.3%, from 3,535 to 3,137. Every core county reported a shorter timing median, including Broomfield, where contract activity increased.
This apparent contradiction is the subject of the fifth Denver monthly research report. Contract count describes how much activity occurred. Median Days in MLS describes the source's middle elapsed time from listing to accepted offer. The exports supply separate aggregates, not matched individual listings or a time-to-contract estimate for every home currently for sale.
Which counties had fewer contracts and shorter marketing times?
Adams, Arapahoe, Denver, Douglas and Jefferson all met both conditions. Broomfield differed: accepted contracts increased 17.7%, from 79 to 93, while its median Days in MLS declined from 22 to 20.
Scroll horizontally to see all columns.
| County | 2025 contracts | 2026 contracts | Annual change | 2025 median days | 2026 median days |
|---|---|---|---|---|---|
| Adams | 656 | 562 | -14.3% | 32 | 31 |
| Arapahoe | 728 | 672 | -7.7% | 28 | 27 |
| Broomfield | 79 | 93 | +17.7% | 22 | 20 |
| Denver | 733 | 634 | -13.5% | 34 | 28 |
| Douglas | 646 | 506 | -21.7% | 35 | 32 |
| Jefferson | 693 | 670 | -3.3% | 25 | 20 |
| Boulder (separate) | 363 | 308 | -15.2% | 30 | 24 |
Annual changes compare August 2026 with August 2025. Days are the source-reported median from listing to accepted offer. Boulder is outside the six-county core.
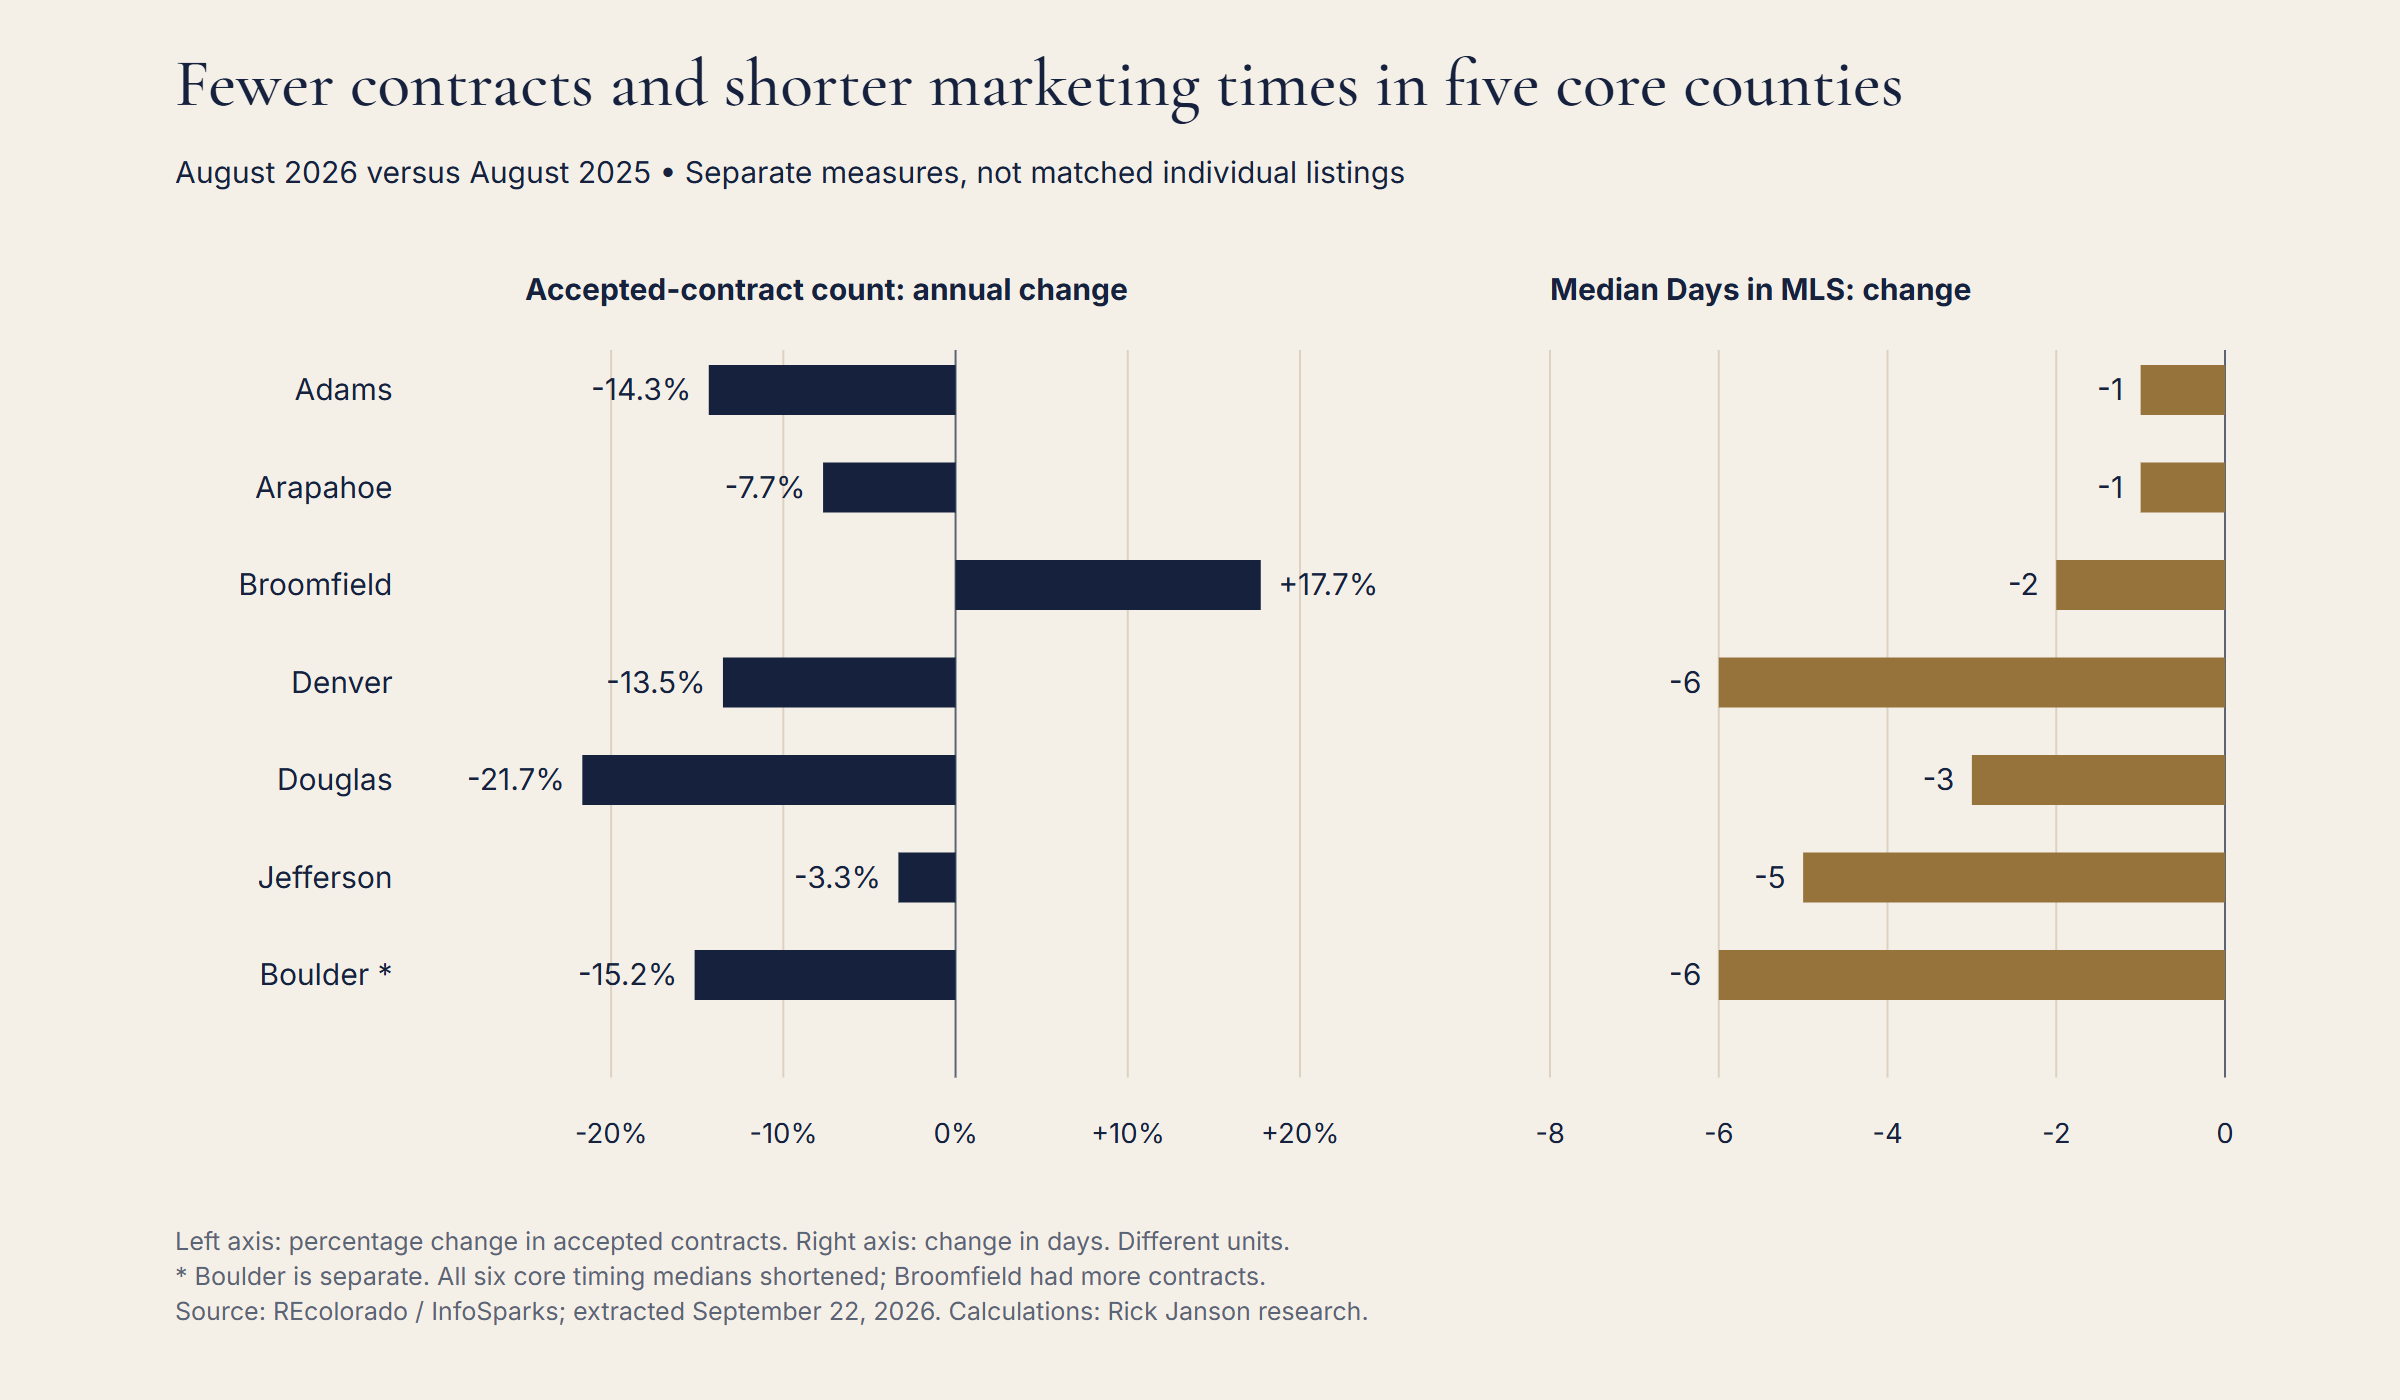
Douglas had the largest percentage decline in contract activity among the core counties, at 21.7%, from 646 to 506. Its timing median shortened by three days, from 35 to 32. Denver's contract count fell 13.5%, from 733 to 634, while its median shortened by six days, from 34 to 28.
Adams and Arapahoe each had only a one-day reduction in their median, alongside contract-count declines of 14.3% and 7.7%. These small timing changes qualify under the stated rule, but they are not presented as statistically significant improvements. Jefferson's count fell 3.3%, while its median shortened from 25 to 20 days.
Boulder, shown separately, had a 15.2% contract decline and a median that shortened from 30 to 24 days. It does not enter the five-of-six finding or the combined core contract count.
Did the pattern last through the summer?
Only Adams and Denver had both fewer accepted contracts and a shorter median in each of June, July and August 2026 versus the matching 2025 month. The broader August finding therefore should not be described as a uniform three-month pattern.
Scroll horizontally to see all columns.
| County | 2025 contracts | 2026 contracts | Annual change | June day change | July day change | August day change | Qualifying months / 3 |
|---|---|---|---|---|---|---|---|
| Adams | 1,886 | 1,733 | -8.1% | -4 | -6 | -1 | 3 |
| Arapahoe | 2,259 | 2,123 | -6.0% | +0 | -3 | -1 | 2 |
| Broomfield | 239 | 270 | +13.0% | +0 | +7 | -2 | 0 |
| Denver | 2,356 | 2,067 | -12.3% | -3 | -3 | -6 | 3 |
| Douglas | 1,831 | 1,704 | -6.9% | +2 | -3 | -3 | 2 |
| Jefferson | 2,213 | 2,035 | -8.0% | +1 | -4 | -5 | 2 |
| Boulder (separate) | 1,175 | 1,061 | -9.7% | +3 | -8 | -6 | 2 |
The contract figures sum June–August activity. The day changes remain separate monthly median comparisons. No three-month median is calculated.
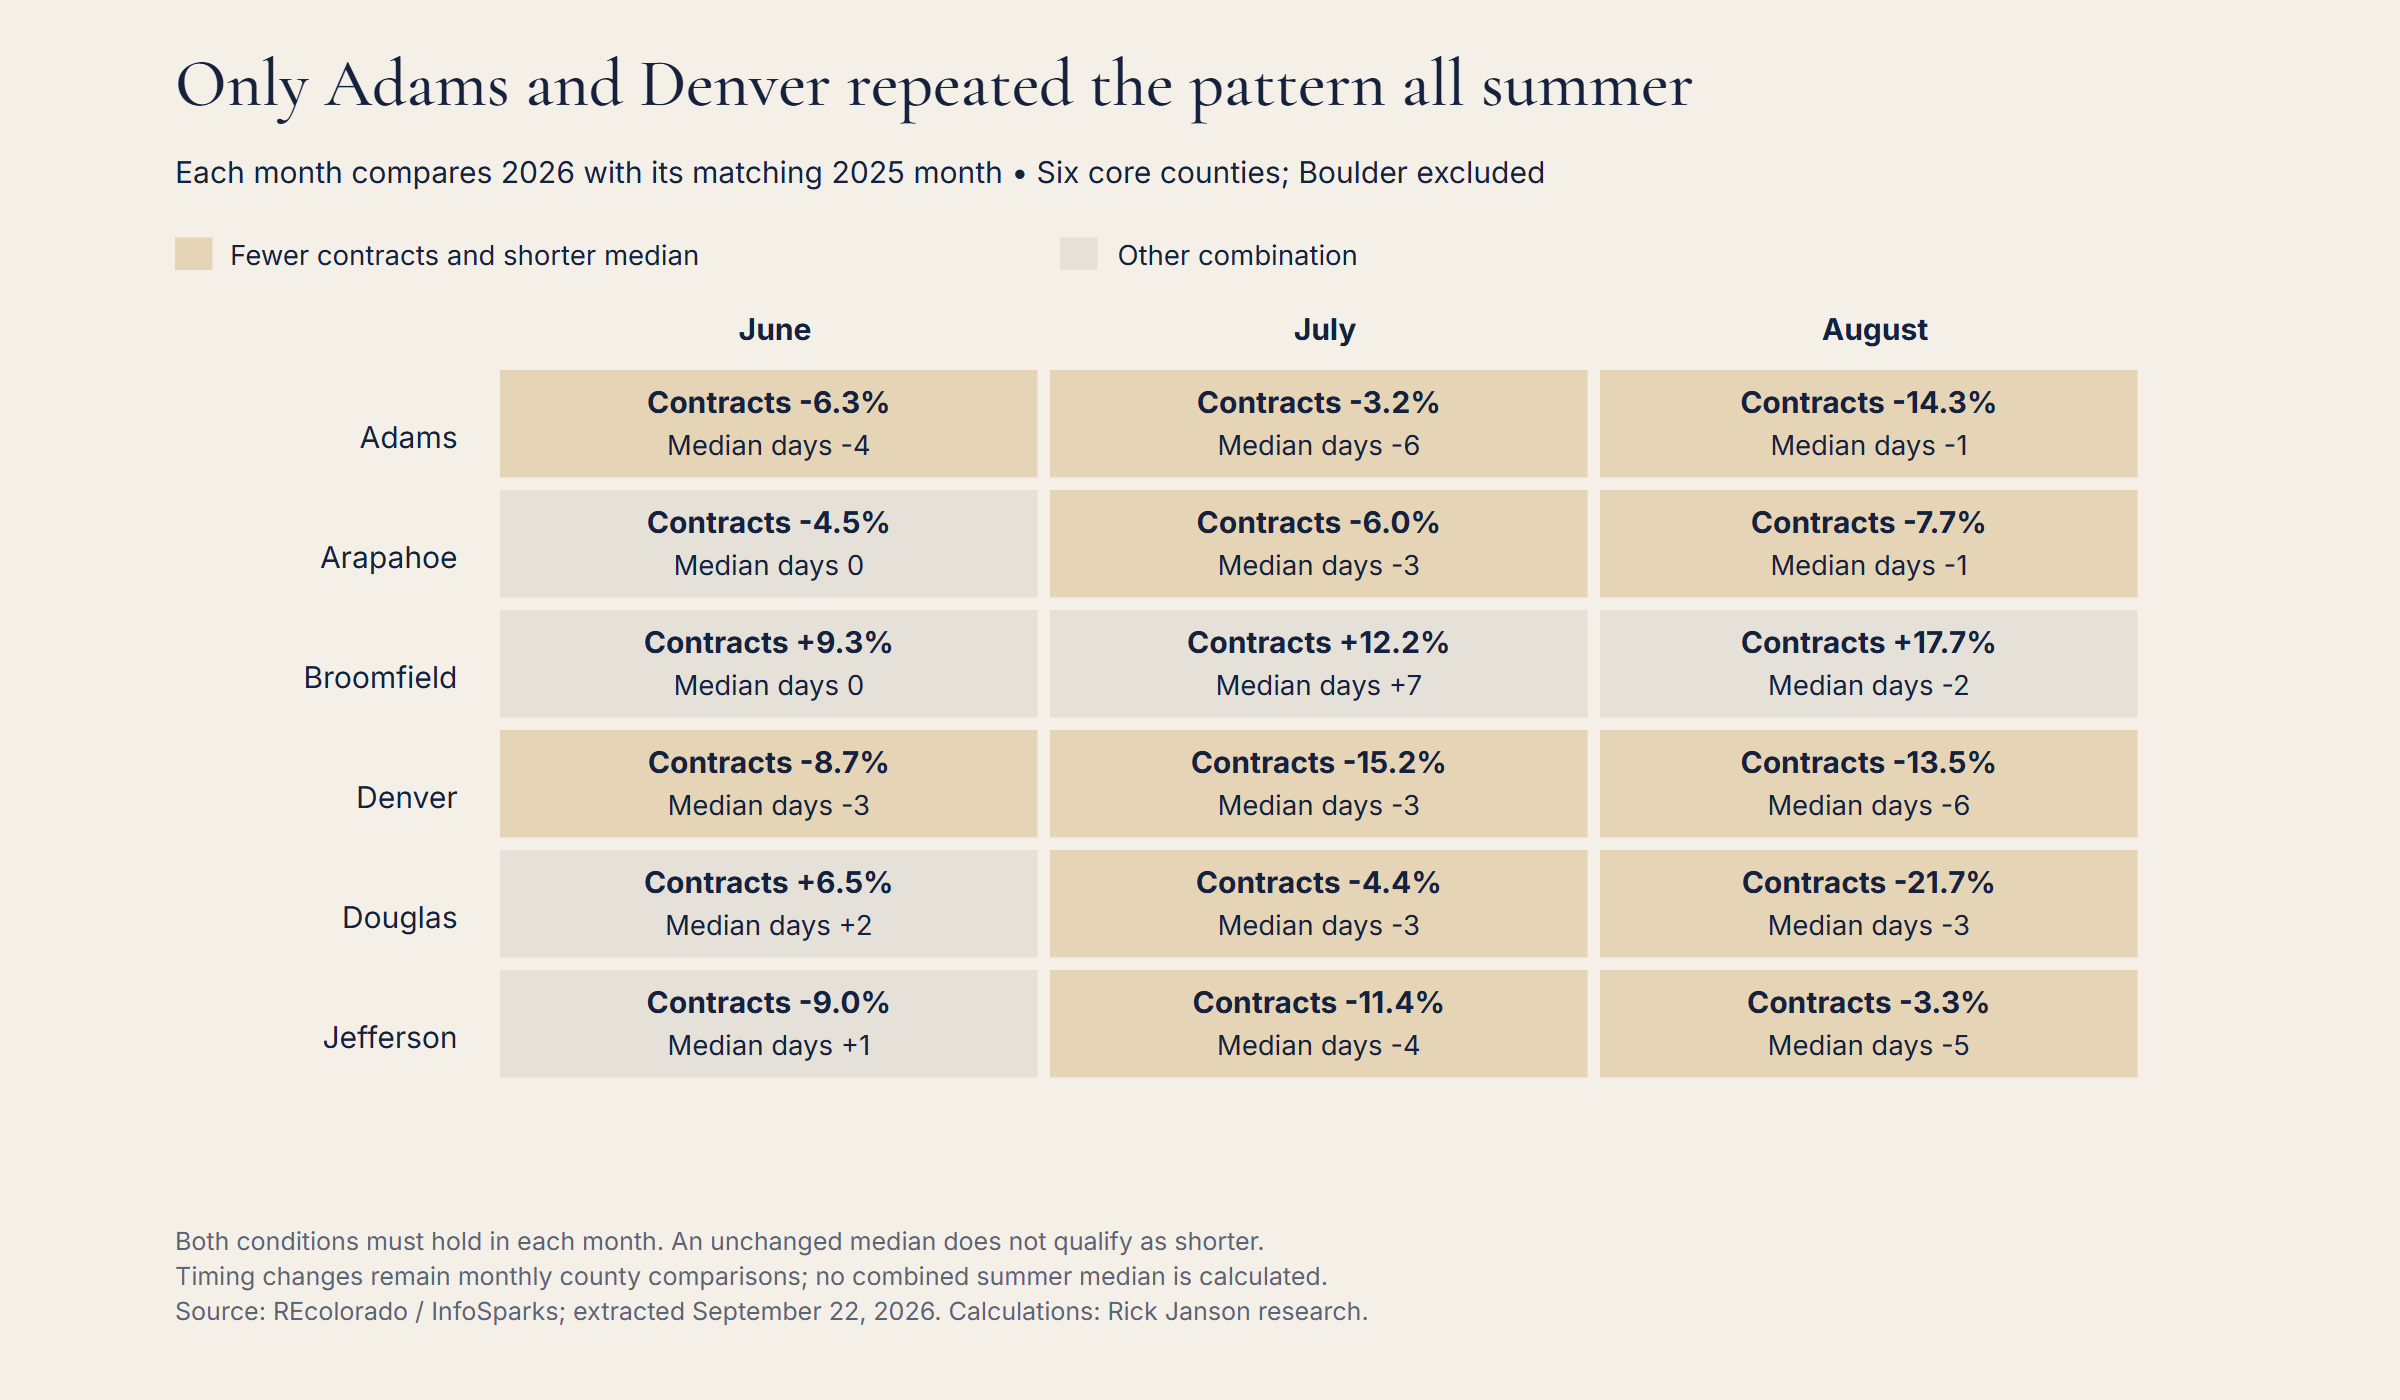
The exceptions are informative. In June, Arapahoe had fewer contracts but an unchanged 18-day median. Jefferson had fewer contracts but a median that increased from 13 to 14 days. Douglas had more contracts and a longer median that month. Each of those counties then had fewer contracts and shorter medians in July and August.
Broomfield never met both conditions during the three-month window. Its accepted-contract count was higher in every month; timing was unchanged in June, longer in July and shorter in August. This is why a regional summary needs its county-level evidence.
What happened to the combined contract count?
The core counties recorded 9,932 accepted-contract events during June–August 2026, compared with 10,784 in the matching 2025 period. That is 852 fewer, or a 7.9% decline.
Scroll horizontally to see all columns.
| Month | 2025 contracts | 2026 contracts | Annual change |
|---|---|---|---|
| 2026-06 | 3,772 | 3,597 | -4.6% |
| 2026-07 | 3,477 | 3,198 | -8.0% |
| 2026-08 | 3,535 | 3,137 | -11.3% |
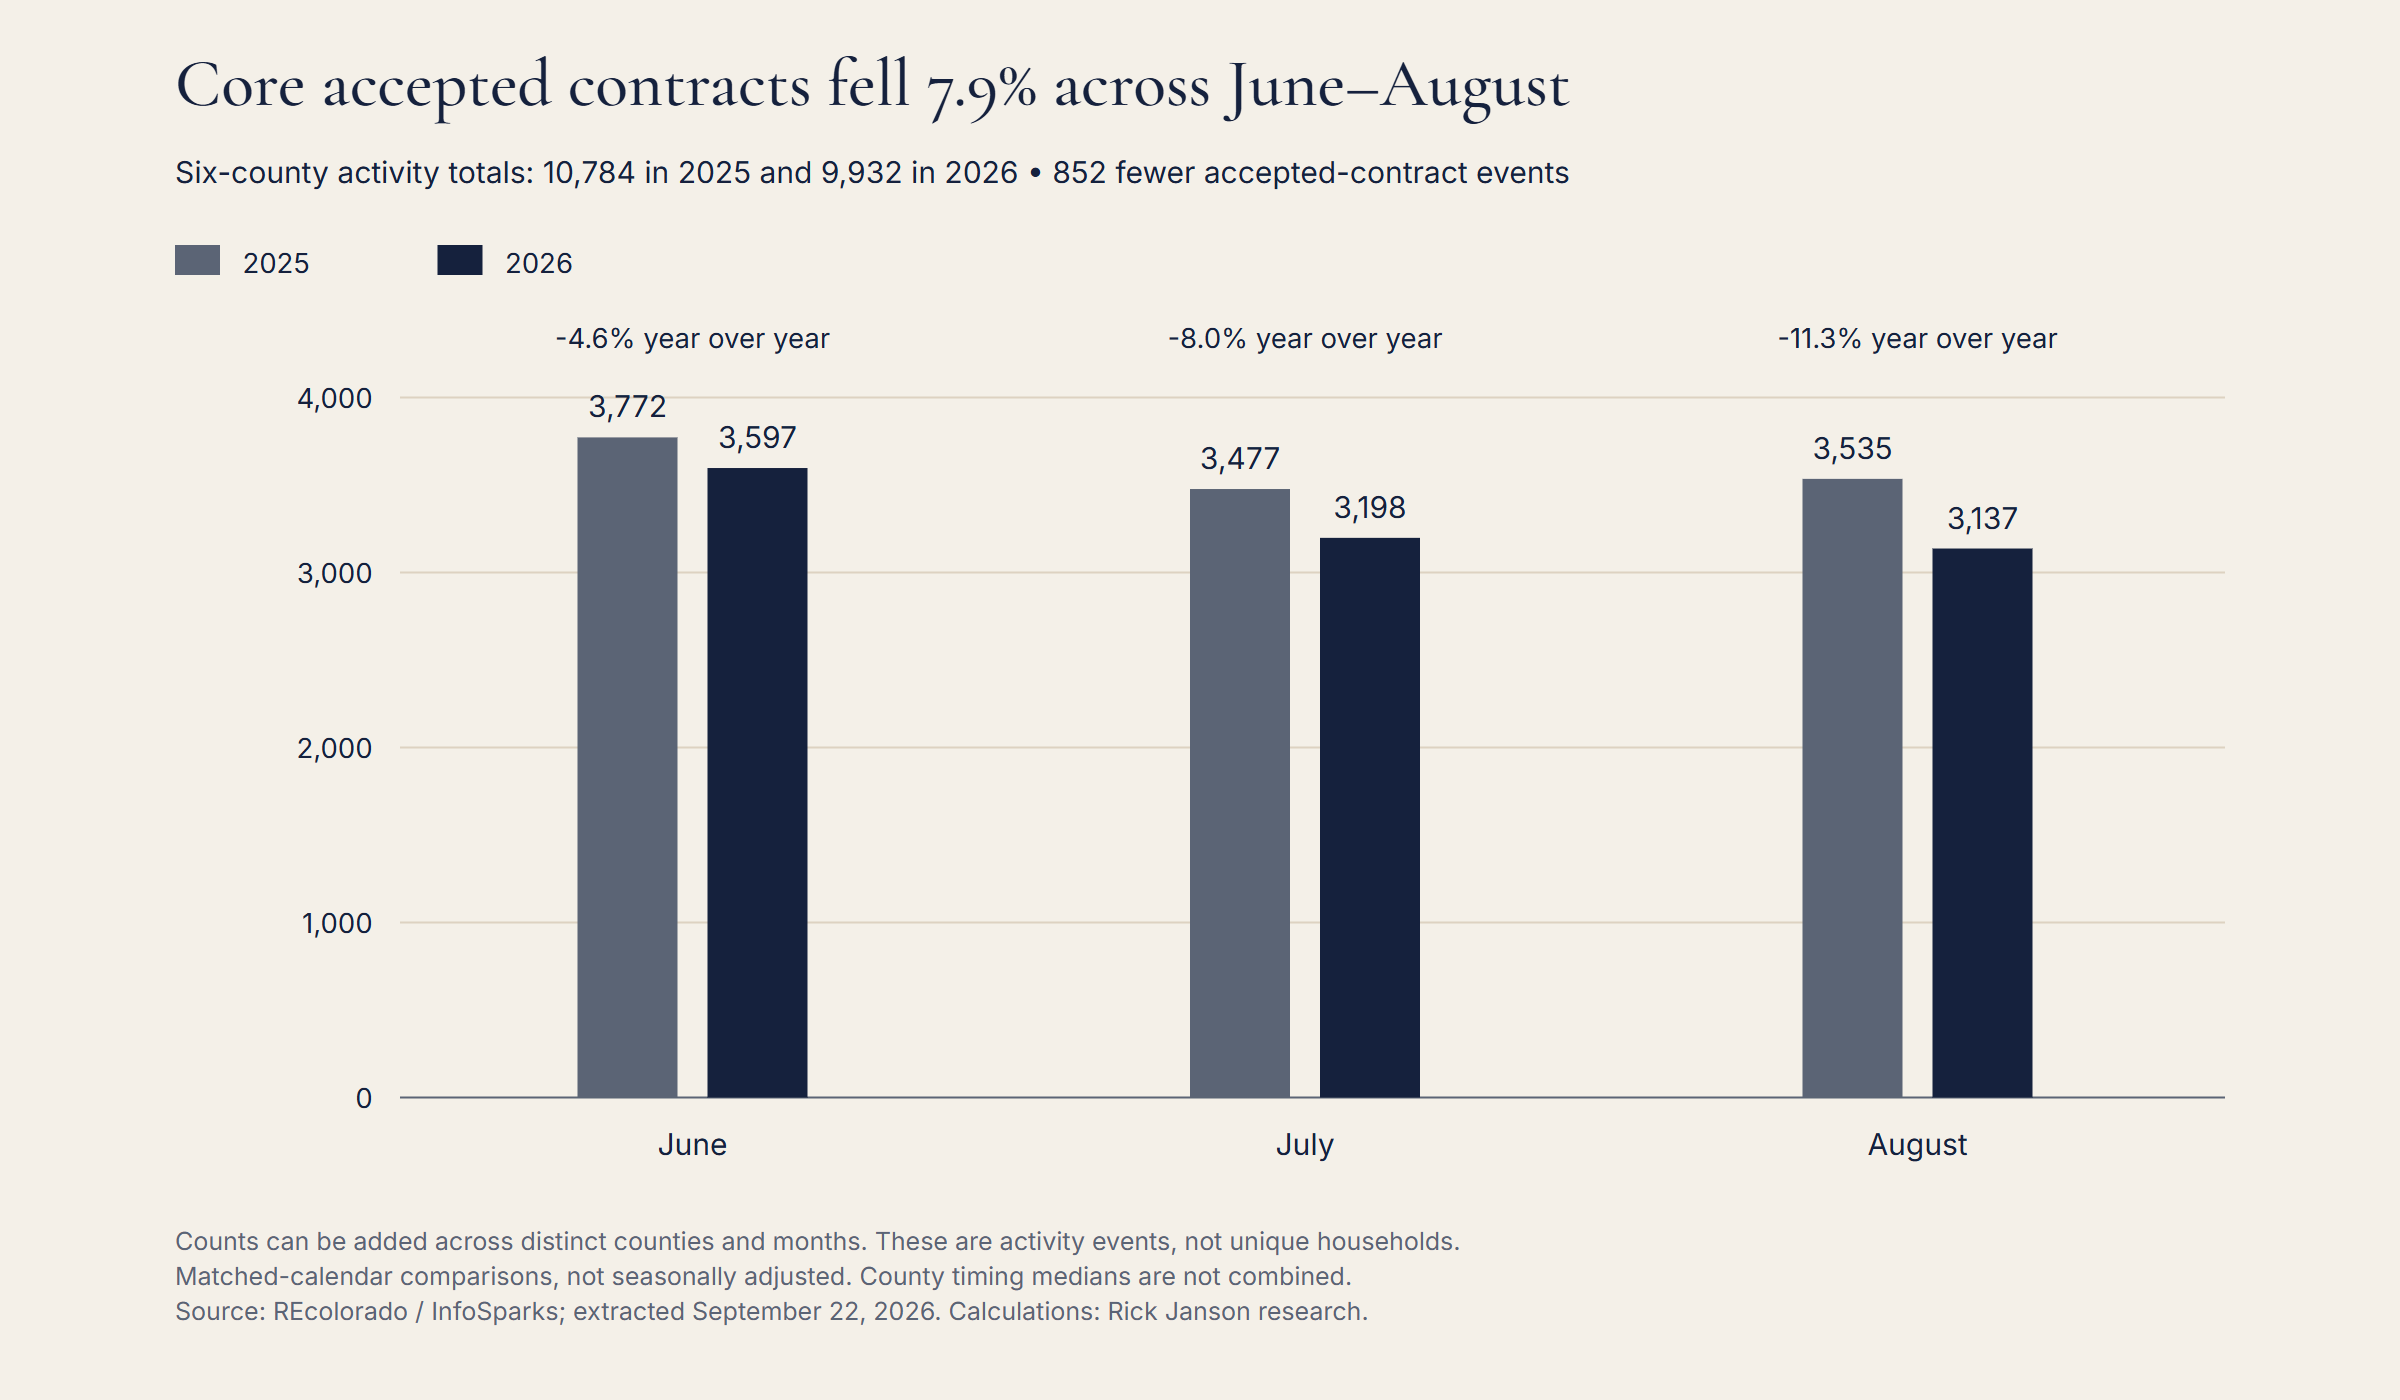
The annual contract-count gap widened across these three observations: down 4.6% in June, 8.0% in July and 11.3% in August. These comparisons match calendar months but are not seasonally adjusted. They describe the extraction vintage and do not forecast the next month's contracts.
County activity counts can be added across distinct counties. County timing medians cannot be combined by a simple average, even a sales-weighted average, to obtain a valid metro median. This report consequently provides a core contract total alongside separate county timing figures.
Why can fewer contracts coexist with a shorter median?
A count and a timing median answer different questions. A smaller group of accepted offers can coexist with a lower middle marketing time. Listings that remain unsold do not have a completed listing-to-accepted-offer interval merely because another property contracts quickly.
Changes in the mix of properties reaching an accepted offer are one possible explanation. Changes in pricing, property characteristics or which listings remain active are other possibilities. The aggregate exports cannot test those mechanisms. The analysis establishes the co-occurrence of the measures, without identifying its cause or asserting that the exact same records underlie both exports.
For sellers, a shorter county median does not establish that their home will contract sooner. For buyers, a lower contract count does not guarantee negotiating room on a particular listing. Comparable properties and that listing's circumstances provide the evidence needed for those decisions.
Questions this research can answer
How long did Denver County listings take to reach an accepted offer?
The source reported a median of 28 Days in MLS in August 2026, compared with 34 a year earlier. This is a county aggregate, not a deadline for an individual listing or a measure of time to closing.
Does a faster median mean every active home is easier to sell?
No. A reported middle timing value does not describe the unsold inventory or reveal the probability that any particular active home will receive an acceptable offer.
Which counties repeated the fewer-contracts/shorter-time pattern for three months?
Adams and Denver, comparing June, July and August 2026 separately with their corresponding 2025 months. Unchanged timing does not qualify as shorter.
Can the two series reveal a sale or conversion probability?
No. They are separately reported monthly aggregates. The exports lack the listing-level cohort, active-listing exposure time and transaction matching needed for that calculation.
For related local evidence, see Denver Housing Market, August 2026: More Listings, Fewer Contracts, Denver Housing Inventory Is 88% Above 2023, but Flat Year Over Year, Denver Homes Sell Near Asking Even as Four County Price Medians Fall, and Denver Home-Price Measures Disagree in Half of Core Counties. For a buyer or seller evaluating a specific home, comparable properties and the listing's circumstances provide the relevant evidence.
Methodology and source evidence
This edition uses 4 unchanged REcolorado / InfoSparks Monthly CSV exports covering 2 metrics, seven counties and 44 months, January 2023–August 2026. The core research geography is Adams, Arapahoe, Broomfield, Denver, Douglas and Jefferson. Boulder is outside all core totals. The combined filters include all residential property subtypes and price ranges; this is not a luxury-only or detached-only study and does not claim an official MSA boundary.
All 88 overlapping Jefferson County values matched and were deduplicated, leaving 616 unique source values. The extracted metrics are Pending Listings, Median Days in MLS. The source vintage is September 22, 2026. Historical values can change in later exports.
Annual percentage changes compare the same calendar month or explicitly matched multi-month window: (current / prior − 1) × 100. Counts may be summed across distinct counties and periods; monthly activity sums are not deduplicated unique buyers or households. County or monthly medians are never pooled or averaged into broader medians. Ratios and shares use their stated numerators and denominators. Changes in percentages are expressed in percentage points where appropriate.
The analysis is descriptive. It does not establish causes, individual-home outcomes or statistical significance. Each metric's coverage and the additional limits explained above govern its interpretation. No new live-data refresh was performed for this edition.
Download the supporting tables
Metric definitions: InfoSparks manual, which may require login. Public source context: REcolorado market trends.
Suggested citation: Janson, Rick. “Fewer Contracts, Shorter Marketing Times in Five Denver-Area Counties.” Denver Contract-Speed Paradox, Report No. 5, August 2026 edition. Calculations from REcolorado / InfoSparks monthly county exports, extracted September 22, 2026. Published September 22, 2026. https://www.rickjanson.com/research/denver-contract-speed/2026-08/
Based on information from REcolorado®, Inc. for the period January 1, 2023 through August 31, 2026.
REcolorado statistical-publication policy, Section 12.0. Underlying MLS content remains subject to the source's rights and terms.
Talk it through
Need a property-specific comparison?
Compare recent sales, current competition and the relevant details for your property.
Request a review of comparable sales for your property.