
August 2026 research edition
Denver Home-Price Measures Disagree in Half of Core Counties

Published
Data through ; extracted .
Median sale price and median price per square foot moved in opposite annual directions in three of the six core Denver-area counties in August 2026. Arapahoe and Douglas reported higher median sale prices but lower median prices per square foot. Denver County showed the reverse: its median sale price fell while its median price per square foot rose.
An original comparison of REcolorado / InfoSparks monthly exports found that this disagreement also appeared in 23 of 48 county-month comparisons from January through August 2026. That count treats each of six counties in each of eight months as one observation. It is not the percentage of homes whose values rose or fell.
The findings show why a single price headline can give an incomplete picture. The middle sale price and the source's median price per finished square foot describe different aspects of the sales recorded in a month. Neither follows the same homes over time or controls for changes in the properties sold.
Are Denver home prices rising or falling?
For August 2026, the answer depends on the county and the measure. Across the six-county core, four counties had lower median sale prices than a year earlier. Five had lower median prices per square foot. The counties in those groups were not identical.
Scroll horizontally to see all columns.
| County | Median sale price | Annual change | Median $/sq. ft. | Annual change | Direction |
|---|---|---|---|---|---|
| Adams | $489,950 | -2.0% | $228 | -1.3% | Both down |
| Arapahoe | $525,500 | +3.0% | $234 | -4.9% | Opposite |
| Broomfield | $610,000 | -0.8% | $249 | -1.2% | Both down |
| Denver | $575,000 | -1.7% | $362 | +2.3% | Opposite |
| Douglas | $717,500 | +4.0% | $228 | -3.0% | Opposite |
| Jefferson | $630,000 | -3.1% | $280 | -6.0% | Both down |
| Boulder (separate) | $700,000 | -6.1% | $327 | -2.4% | Both down |
Annual change compares August 2026 with August 2025. Price per square foot refers to the source's finished-square-footage measure. The six core counties are Adams, Arapahoe, Broomfield, Denver, Douglas and Jefferson. Boulder is a separate comparison.
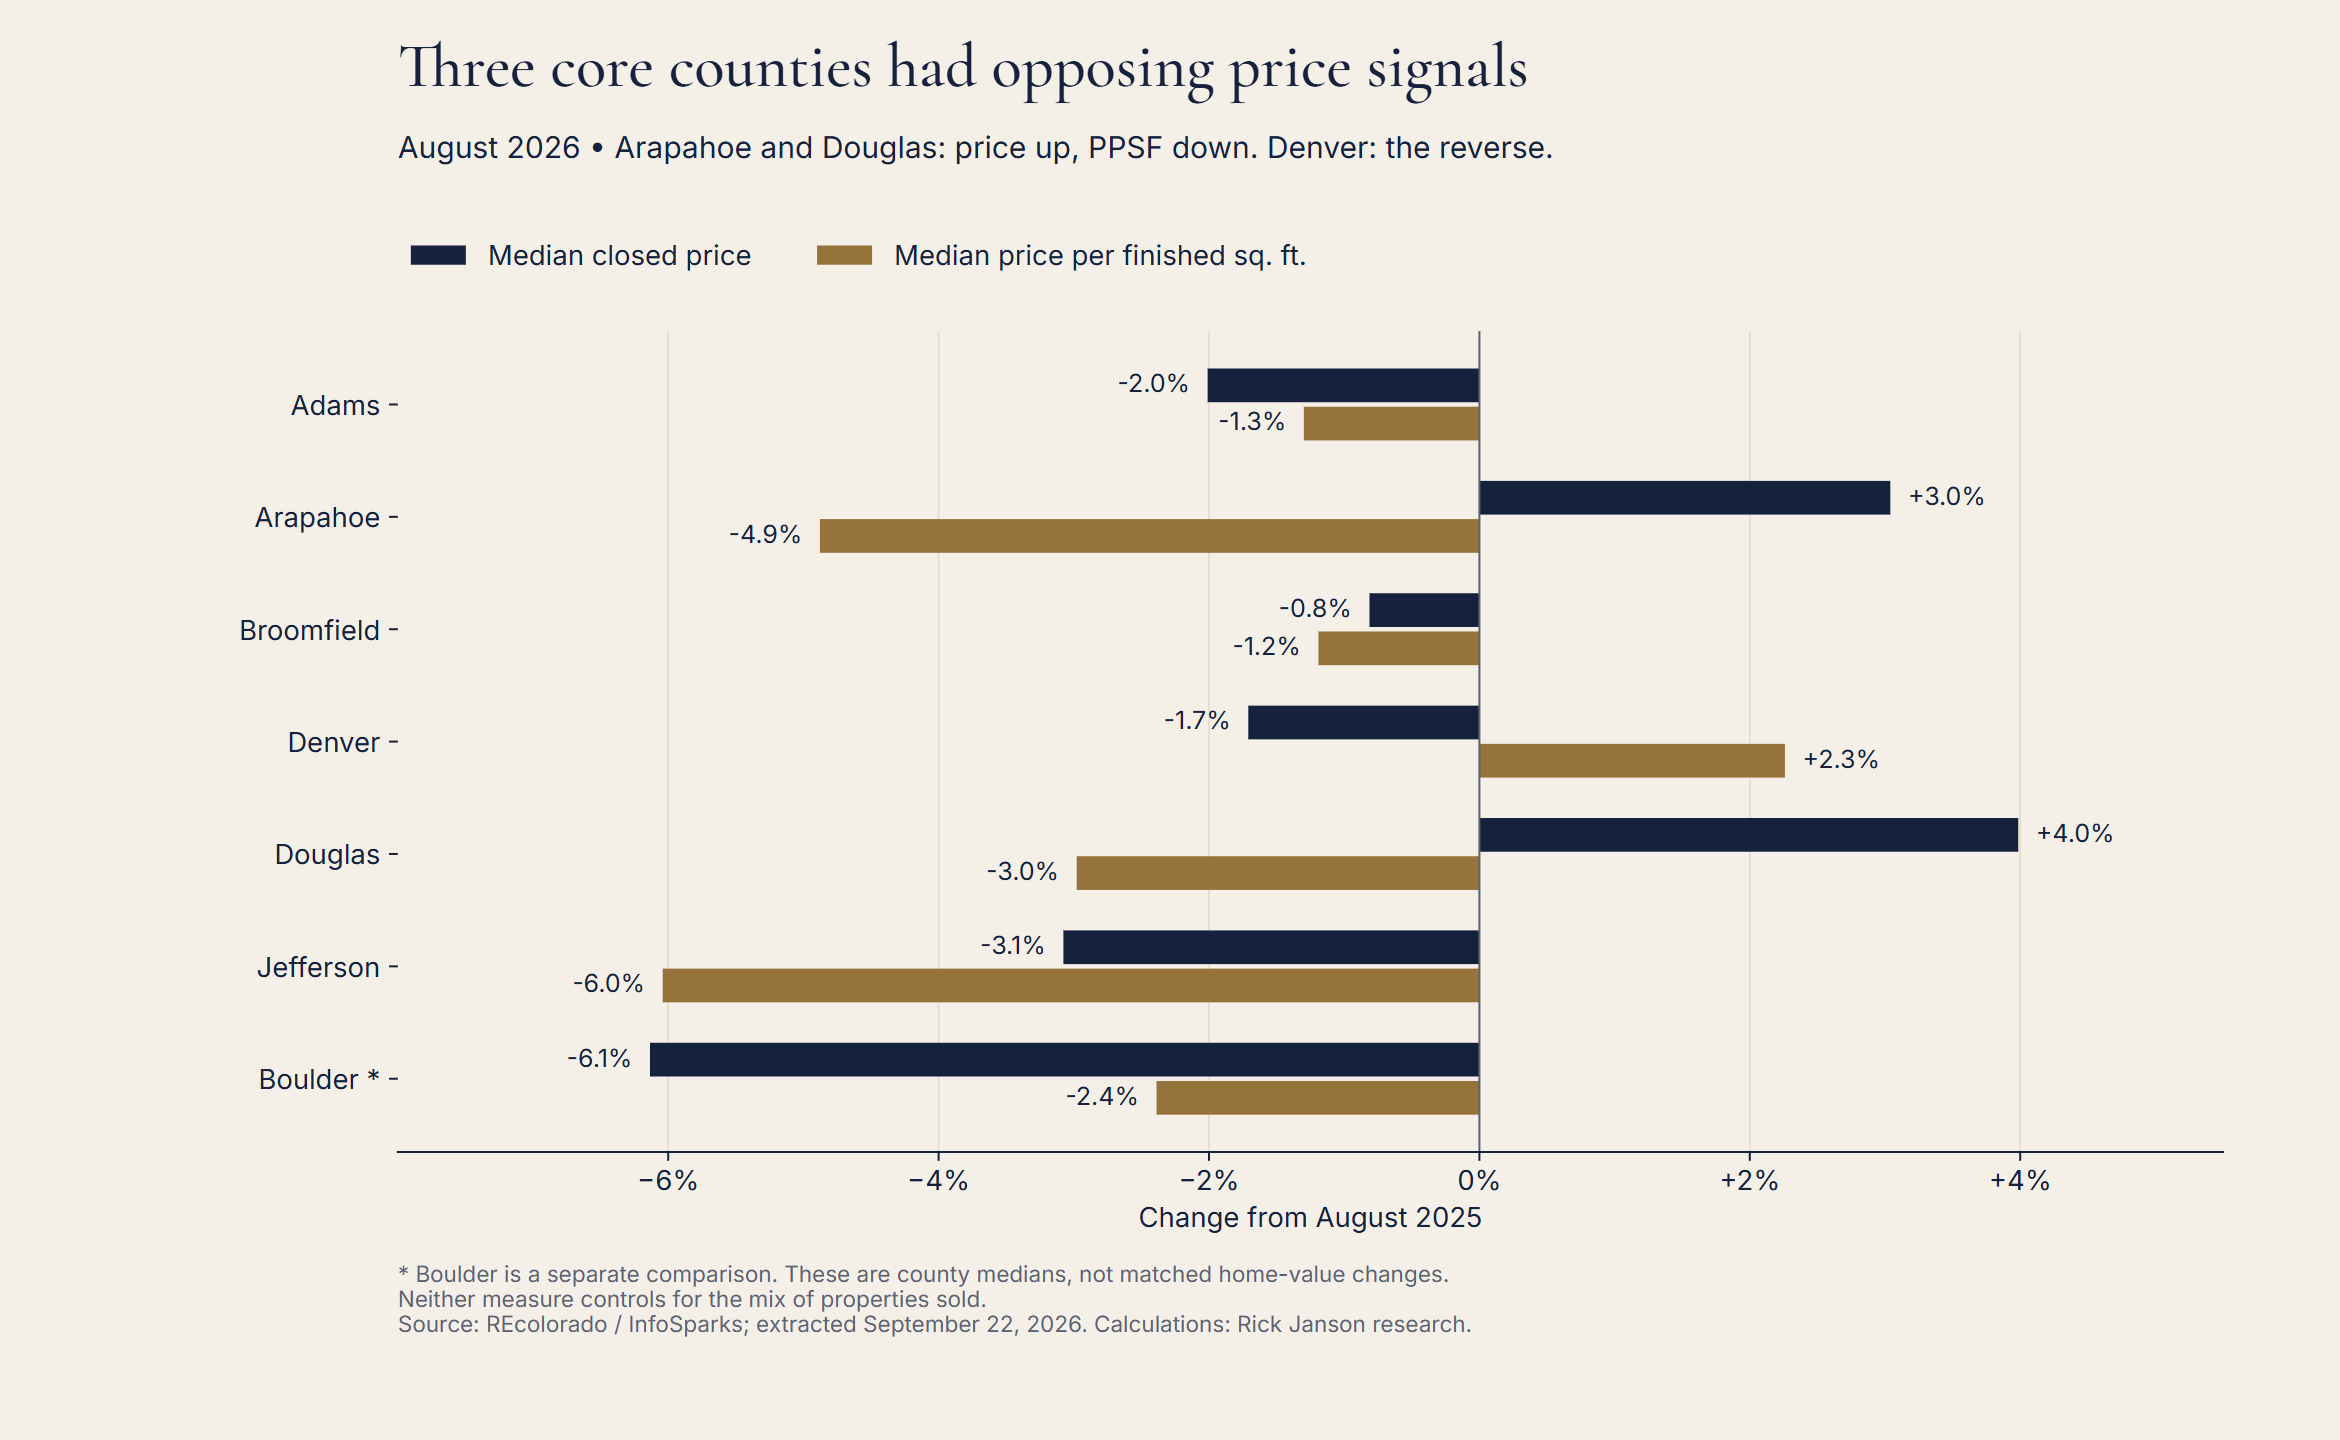
Separate county medians. The chart does not measure appreciation of individual homes or provide a pooled Denver metro median. Source: REcolorado / InfoSparks; calculations by Rick Janson research.
In Arapahoe County, the median sale price increased from $510,000 to $525,500, a 3.0% rise. Median price per square foot declined from $246 to $234, a 4.9% decrease.
In Douglas County, the median sale price rose from $690,000 to $717,500, up 4.0%. Median price per square foot fell from $235 to $228, down 3.0%.
In Denver County, the median sale price declined from $585,000 to $575,000, down 1.7%. Median price per square foot rose from $354 to $362, up 2.3%.
Adams, Broomfield and Jefferson had declines in both measures. Boulder, outside the core count, also had declines in both: its median sale price fell 6.1%, while its median price per square foot fell 2.4%.
How often do the two price measures disagree?
The January–August comparison identifies recurring disagreements, rather than relying on one August snapshot. The rule is straightforward: one measure must rise from its matching prior-year month while the other falls. If either exported measure is unchanged, the observation is classified separately.
Scroll horizontally to see all columns.
| County | Opposite directions, Jan.–Aug. 2026 | With both changes ≥1% | Longest run in this window |
|---|---|---|---|
| Adams | 0 of 8 | 0 | None |
| Arapahoe | 4 of 8 | 4 | 3 months |
| Broomfield | 4 of 8 | 2 | 2 months |
| Denver | 4 of 8 | 4 | 2 months |
| Douglas | 5 of 8 | 3 | 2 months |
| Jefferson | 6 of 8 | 3 | 6 months |
| Boulder (separate) | 2 of 8 | 0 | 1 month |
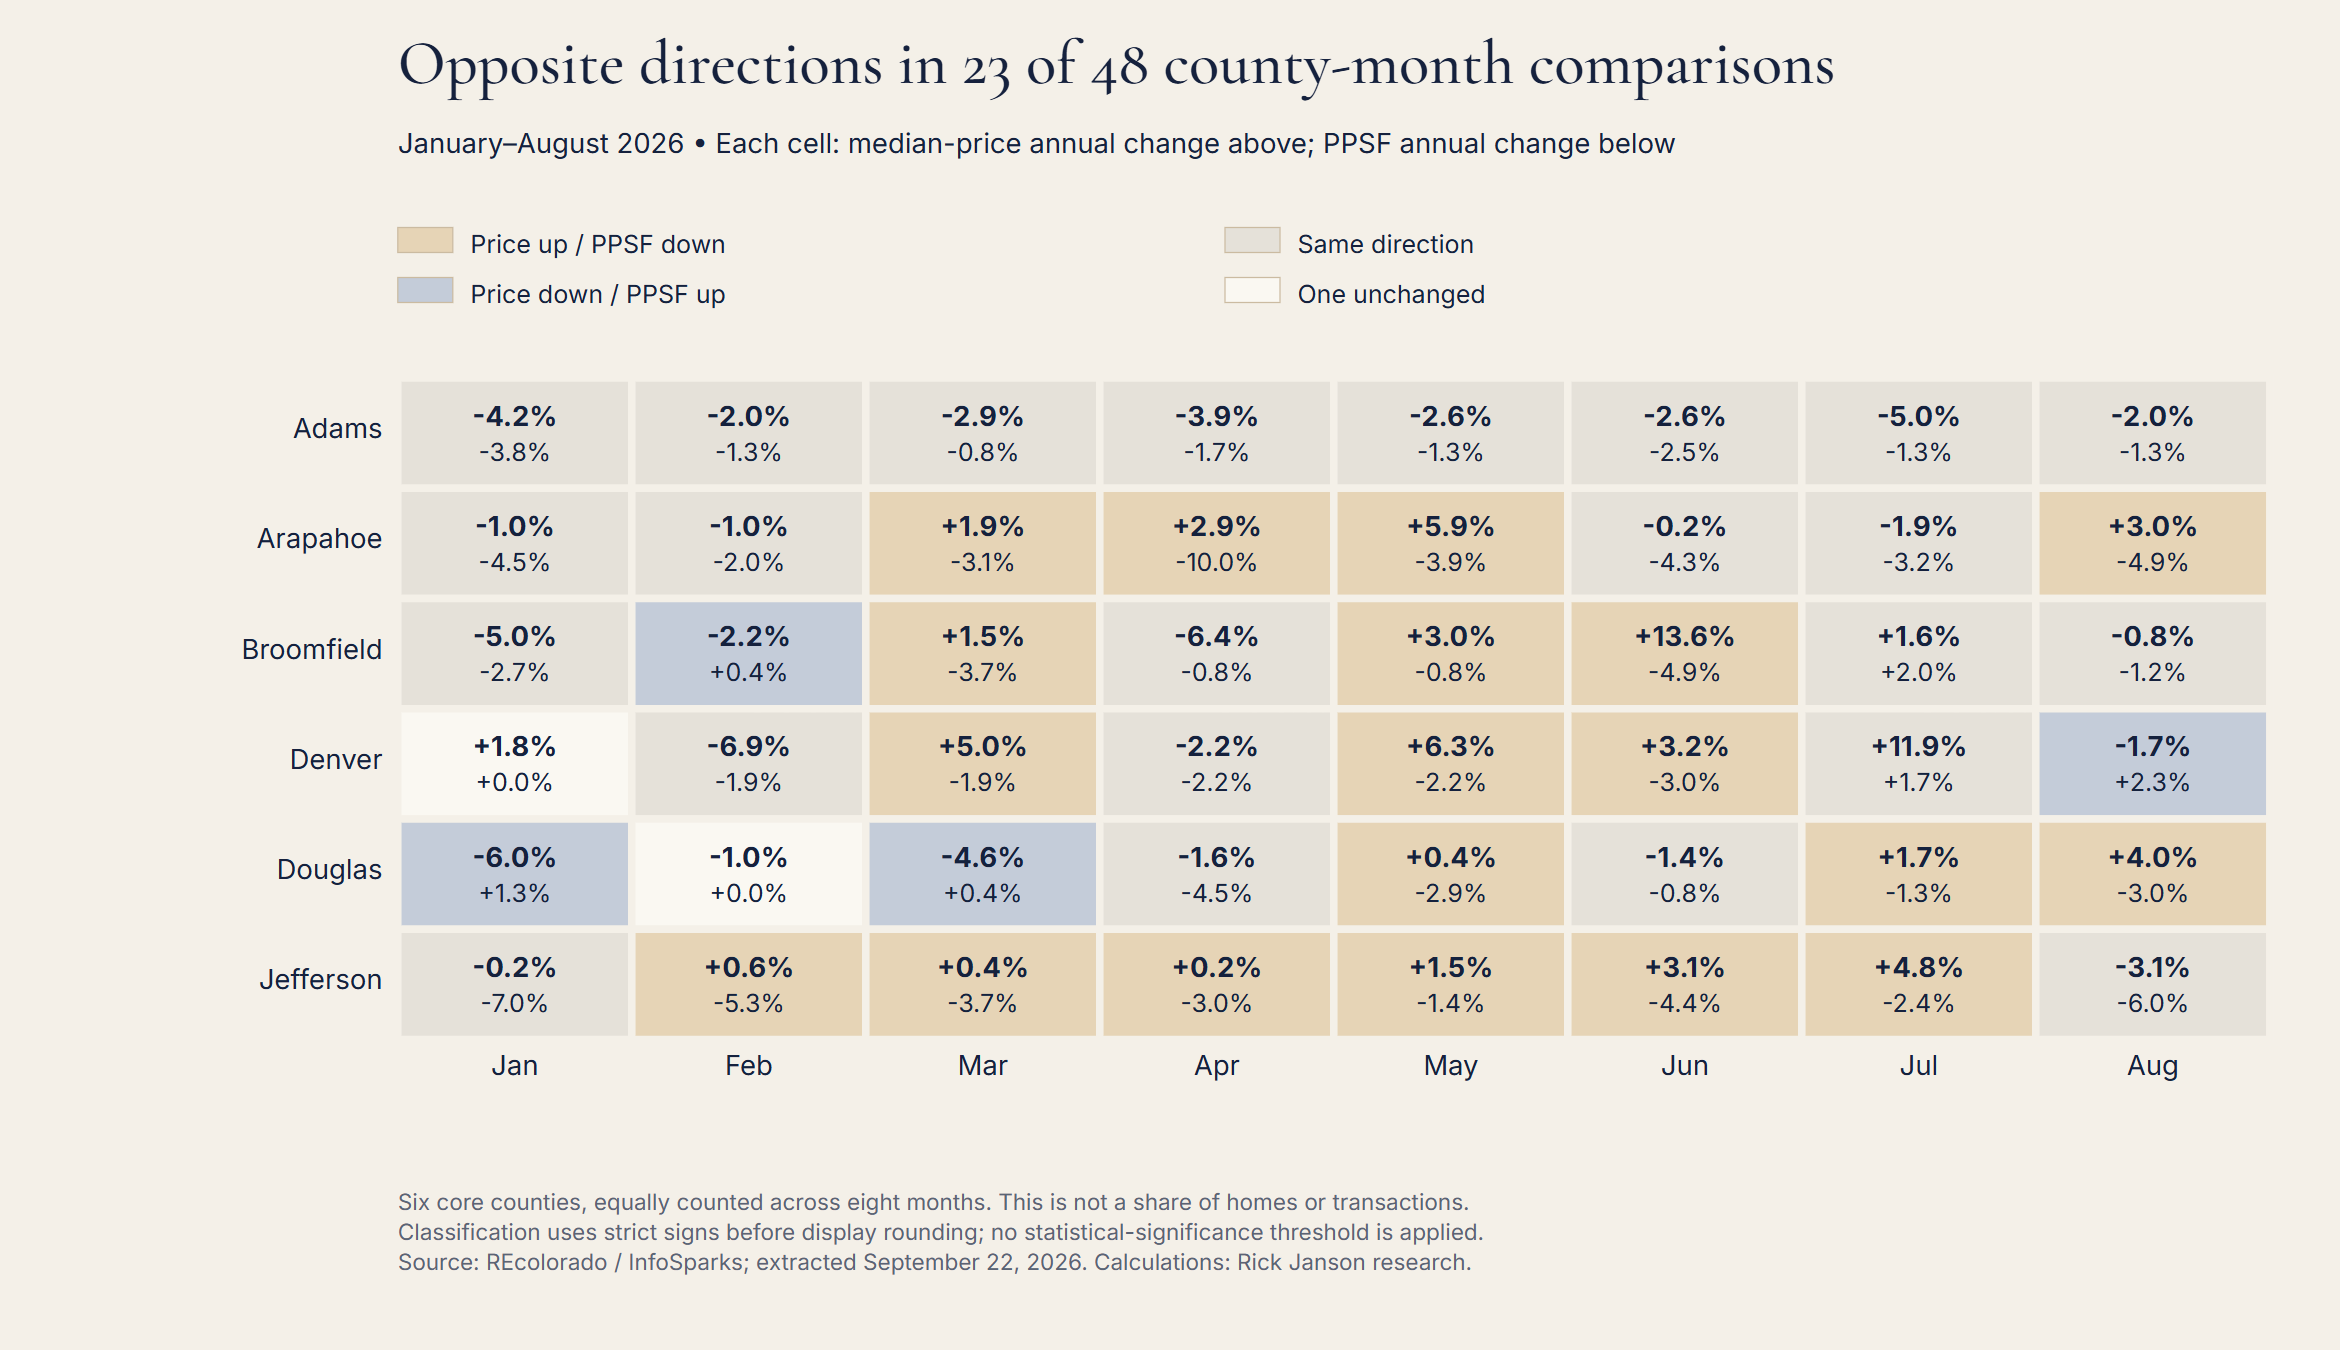
Each cell shows median-price change above and price-per-square-foot change below. Colors distinguish opposing directions, the same direction and an unchanged measure. Boulder is excluded from this chart and the 23-of-48 count.
Jefferson had the most opposite-direction months in this eight-month core comparison, with six. Douglas had five. Arapahoe, Broomfield and Denver each had four. Adams had none; both of its measures were lower than a year earlier in every observed 2026 month.
Some directional disagreements involve small changes. As a descriptive sensitivity check, requiring both annual changes to have an absolute magnitude of at least 1% reduces the core count from 23 to 16 of 48. All three August disagreements still qualify. The 1% cutoff is an illustrative filter, not a statistical-significance threshold or an estimate of measurement error.
Jefferson's six-month split ended in August
Jefferson's median sale price was above its matching 2025 level in every month from February through July 2026. Its median price per square foot was below the matching 2025 level throughout that same six-month run.
Scroll horizontally to see all columns.
| 2026 month | Median sale price | Annual change | Median $/sq. ft. | Annual change |
|---|---|---|---|---|
| January | $615,000 | -0.2% | $277 | -7.0% |
| February | $630,000 | +0.6% | $284 | -5.3% |
| March | $650,000 | +0.4% | $287 | -3.7% |
| April | $649,500 | +0.2% | $290 | -3.0% |
| May | $660,000 | +1.5% | $291 | -1.4% |
| June | $675,000 | +3.1% | $282 | -4.4% |
| July | $660,000 | +4.8% | $287 | -2.4% |
| August | $630,000 | -3.1% | $280 | -6.0% |
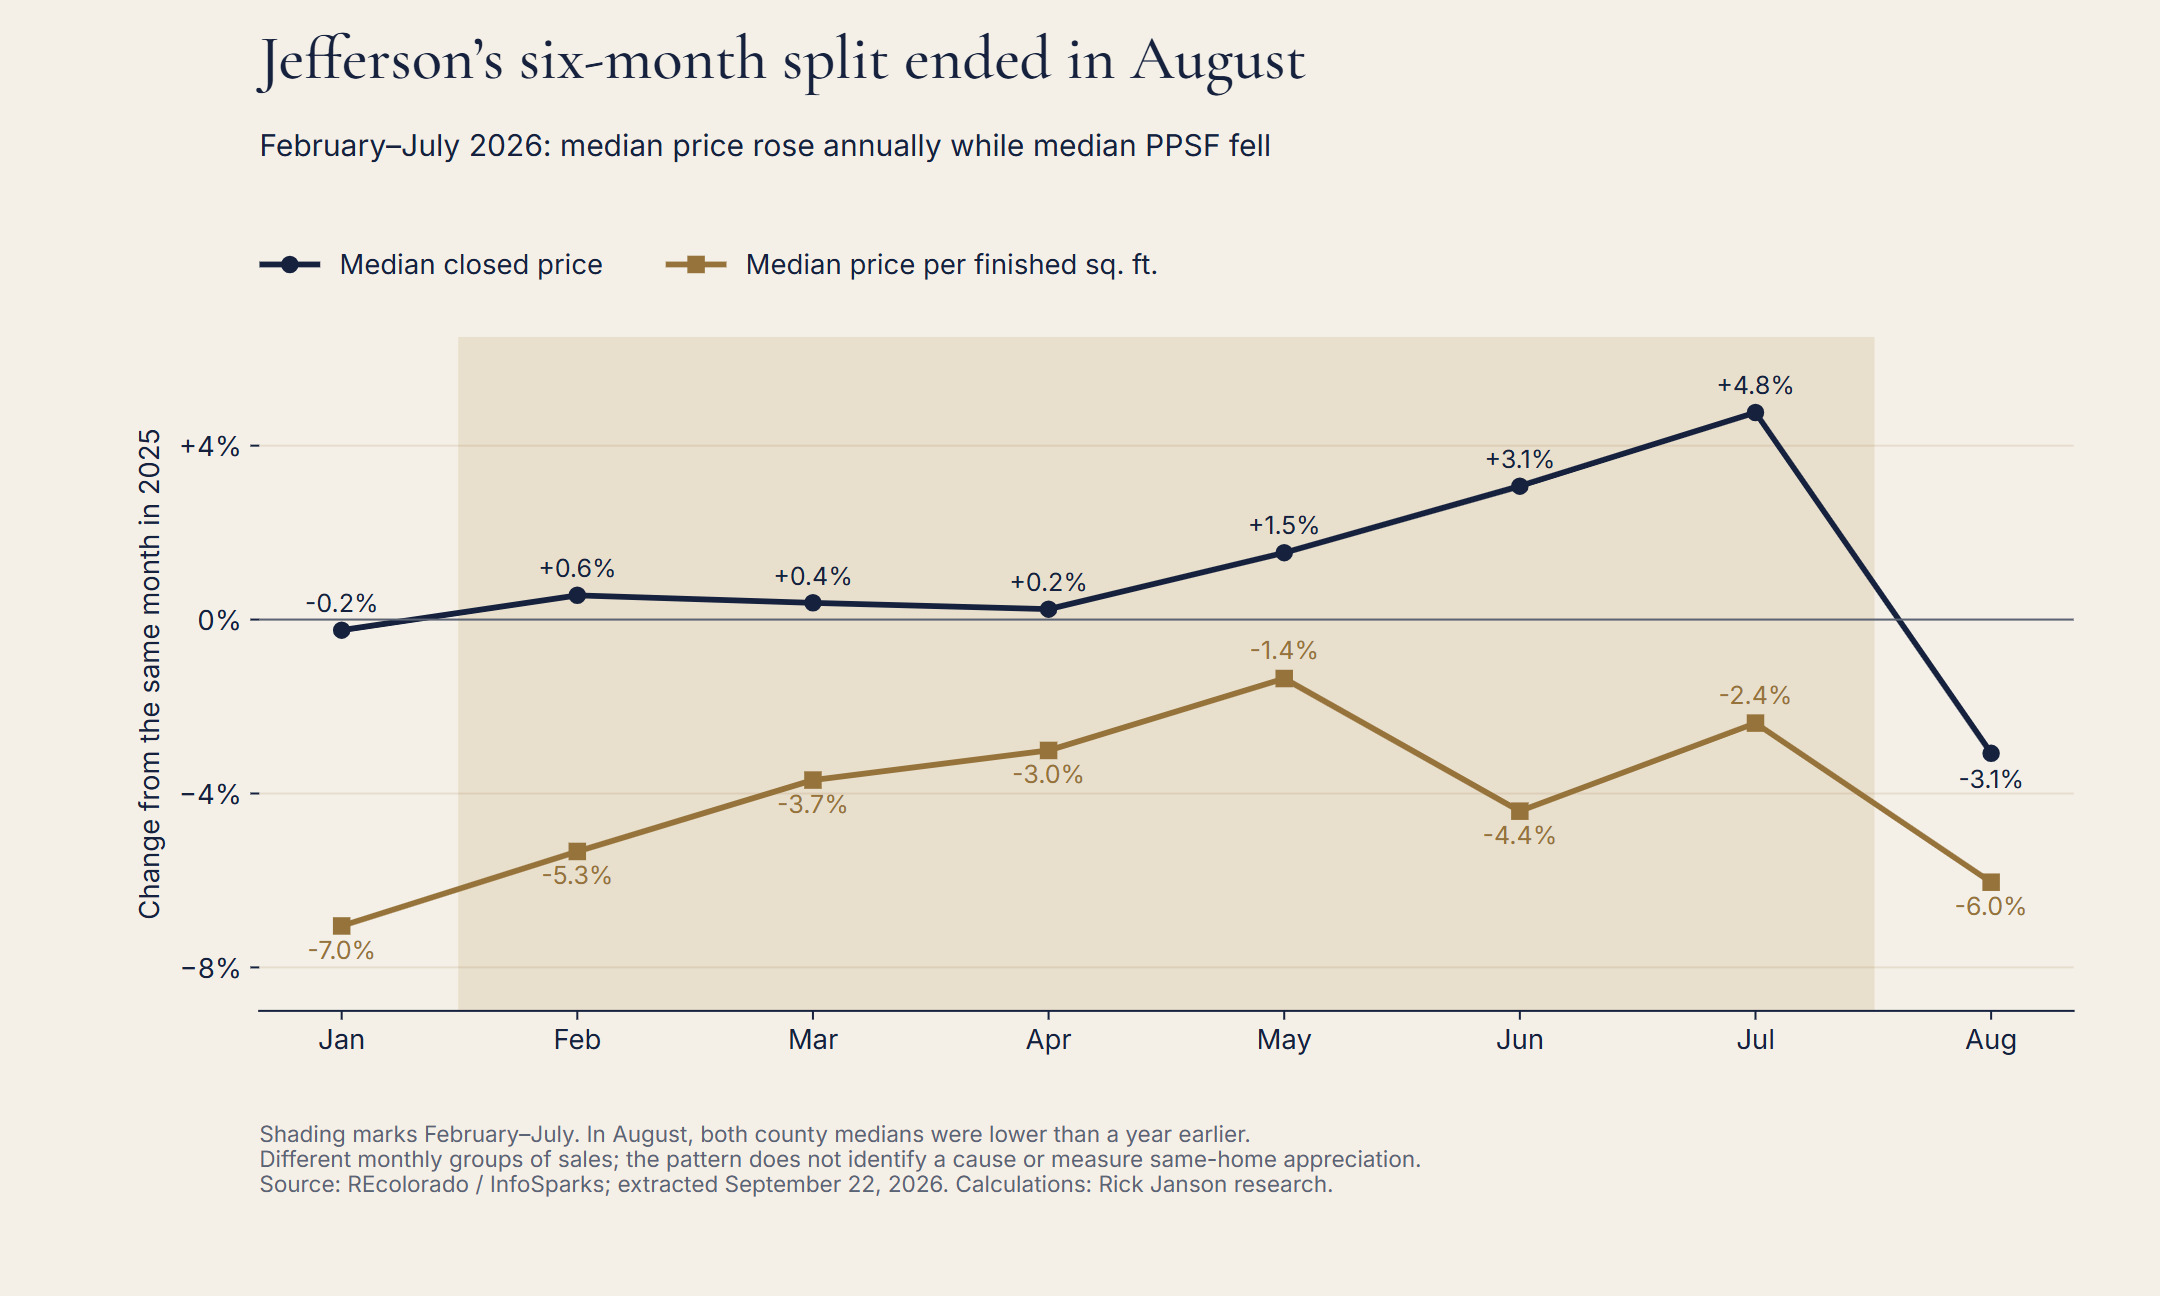
Lines show changes from matching 2025 months, not changes from the immediately preceding month. Shading identifies February–July.
By July, Jefferson's median sale price was 4.8% above July 2025, while median price per square foot was 2.4% lower. In August, the price median fell to $630,000, down 3.1% annually, and median price per square foot was $280, down 6.0%. The two annual directions aligned again.
The series does not show that the same homes gained value through July and lost value in August. Each monthly median reflects that month's sales. It does show that a median-price-only account would have omitted a consistently declining price-per-square-foot series: Jefferson's latter measure was lower year over year in all eight observed 2026 months.
Broomfield had the largest gap between the annual changes
The largest absolute separation between the two annual percentage changes in the 48 core county-month observations occurred in Broomfield in June 2026. Median sale price rose from $640,000 to $727,000, or 13.6%. Median price per square foot fell from $265 to $252, or 4.9%.
The difference between those growth rates was 18.5 percentage points, calculated before display rounding. Broomfield reported 112 closings that month, compared with 116 in June 2025. Those counts provide volume context; they are not verified eligible sample sizes for both price measures.
That gap is a reason to inspect the two measures together. It is not an estimate of how much home size changed, a price adjustment or proof that buyers preferred larger properties.
Why can median price rise while price per square foot falls?
The two measures describe different quantities, and the mix of sold properties can change. Median sale price reports a middle dollar amount. The source's median price per square foot reports a price measure expressed relative to finished floor area. Location, property type, condition, age and the distribution of home sizes remain relevant to interpreting both.
A shift toward larger homes is one possible explanation for a higher sale-price median alongside a lower price-per-square-foot median. A change in neighborhoods or property types is another possibility. This study cannot identify which explanation, if any, caused an observed county pattern. The exports do not provide the individual records needed to test those hypotheses.
Dividing the county median sale price by the county median price per square foot does not solve the problem. The medians can correspond to different positions in different distributions, and eligible records may differ. Their quotient is not an established measure of the county's median home size. This report does not use it as one.
For a buyer or seller evaluating a specific home, these county figures are background. Comparable properties, their features and transaction terms are needed for a property-level pricing assessment. A rising county price-per-square-foot median alone does not establish that a particular home appreciated.
Common questions about Denver price per square foot
What was Denver County's median price per square foot in August 2026?
The source reported $362 per finished square foot, up 2.3% from $354 in August 2025. Denver County's median sale price moved in the other direction, falling 1.7% to $575,000. These figures describe Denver County, not a combined metro area.
Which counties had conflicting price directions in August?
Arapahoe, Denver and Douglas. Arapahoe and Douglas had higher median sale prices and lower median prices per square foot. Denver had a lower median sale price and a higher median price per square foot.
Is price per square foot a better measure of appreciation?
It adds useful context, but this county aggregate is not a repeat-sales or quality-adjusted appreciation index. Both measures can change when the mix of sold homes changes. The data does not identify one as the true rate of home-value appreciation.
Does 23 of 48 mean nearly half of homes had conflicting valuations?
No. It counts county-month comparisons, with each county and month counted equally. It does not classify individual homes, weight observations by sales volume or estimate a probability for a particular property.
For related local evidence, see Denver Housing Market, August 2026: More Listings, Fewer Contracts, Denver Housing Inventory Is 88% Above 2023, but Flat Year Over Year, and Denver Homes Sell Near Asking Even as Four County Price Medians Fall. These editions address listing and contract activity, inventory, and closing prices relative to asking, respectively.
Methodology and downloadable evidence
The analysis uses six REcolorado / InfoSparks Monthly CSV exports: median closed price, median price per square foot and closed-listing count, each exported for two overlapping county groups. They cover January 2023 through August 2026 across seven counties. The six-county core is a custom research geography; Boulder is separate.
After verifying and removing 132 matching Jefferson County overlaps, the source contains 924 unique county-month-metric values. The full year-over-year comparison history contains 32 monthly observations per county, January 2024 through August 2026. January 2023 is the beginning of this extract, not a long-run or pre-pandemic baseline.
Each annual percentage change equals (current month / matching prior-year month − 1) × 100. Direction is classified using the exported values before rounding the displayed changes to one decimal. Exported price-per-square-foot values have whole-dollar precision. No county medians are averaged into a metro median, and no monthly medians are pooled into a quarterly or annual figure.
Both price measures use sold data and exclude adjustments for seller concessions. The source applies data exclusions, so closed-listing totals are volume context rather than verified sample sizes for every median. No seasonal adjustment, property-level matching, causal estimate or statistical-significance test is performed. Historical data may change in later extraction vintages.
- August county price signals and closing counts (CSV)
- Complete monthly annual comparisons, January 2024–August 2026 (CSV)
- County divergence counts and longest runs (CSV)
- InfoSparks metric definitions — login may be required.
- REcolorado market trends
Suggested citation: Janson, Rick. “Denver Home-Price Measures Disagree in Half of Core Counties.” Denver Price Signals, Report No. 4, August 2026 edition. Calculations from REcolorado / InfoSparks monthly county exports, extracted September 22, 2026. Published September 22, 2026. https://www.rickjanson.com/research/denver-price-signals/2026-08/
Based on information from REcolorado®, Inc. for the period January 1, 2023 through August 31, 2026.
REcolorado statistical-publication policy, Section 12.0. Underlying MLS content remains subject to the source's rights and terms.
Talk it through
Need a property-specific comparison?
Compare recent sales, current competition and the relevant details for your property.
Request a review of comparable sales for your property.