

August 2026 research edition
Fewer Showings Before Contract in Four Denver-Area Counties

Published
Data through ; extracted .
Four of six core Denver-area counties reported fewer median scheduled showings before a listing went under contract in August 2026 than a year earlier. Arapahoe, Denver, Douglas and Jefferson also had lower accepted-contract counts. Adams and Broomfield had unchanged showing medians.
That combination is the central finding of the Denver Showing Effort Monitor. It does not mean buyers became more numerous or marketing became more efficient. The showing measure describes a defined subset of listings, while the contract-count series describes a different monthly aggregate.
How many showings preceded an accepted contract?
In August 2026, source-reported median showings to pending ranged from 10 to 12 across the core counties. Arapahoe, Denver and Douglas each reported 10; Adams and Jefferson reported 11; Broomfield reported 12.
Scroll horizontally to see all columns.
| County | 2025 showing median | 2026 showing median | Showing change | Contract annual change | 2026 median days |
|---|---|---|---|---|---|
| Adams | 11 | 11 | +0 | -14.3% | 31 |
| Arapahoe | 11 | 10 | -1 | -7.7% | 27 |
| Broomfield | 12 | 12 | +0 | +17.7% | 20 |
| Denver | 11 | 10 | -1 | -13.5% | 28 |
| Douglas | 12 | 10 | -2 | -21.7% | 32 |
| Jefferson | 12 | 11 | -1 | -3.3% | 20 |
| Boulder (separate) | 12.5 | 9 | -3.5 | -15.2% | 24 |
The showing metric includes only ShowingTime-enabled listings with a showing in their first 28 days. It counts scheduled showings, not unique buyers. Pending-count changes compare separate county activity totals.
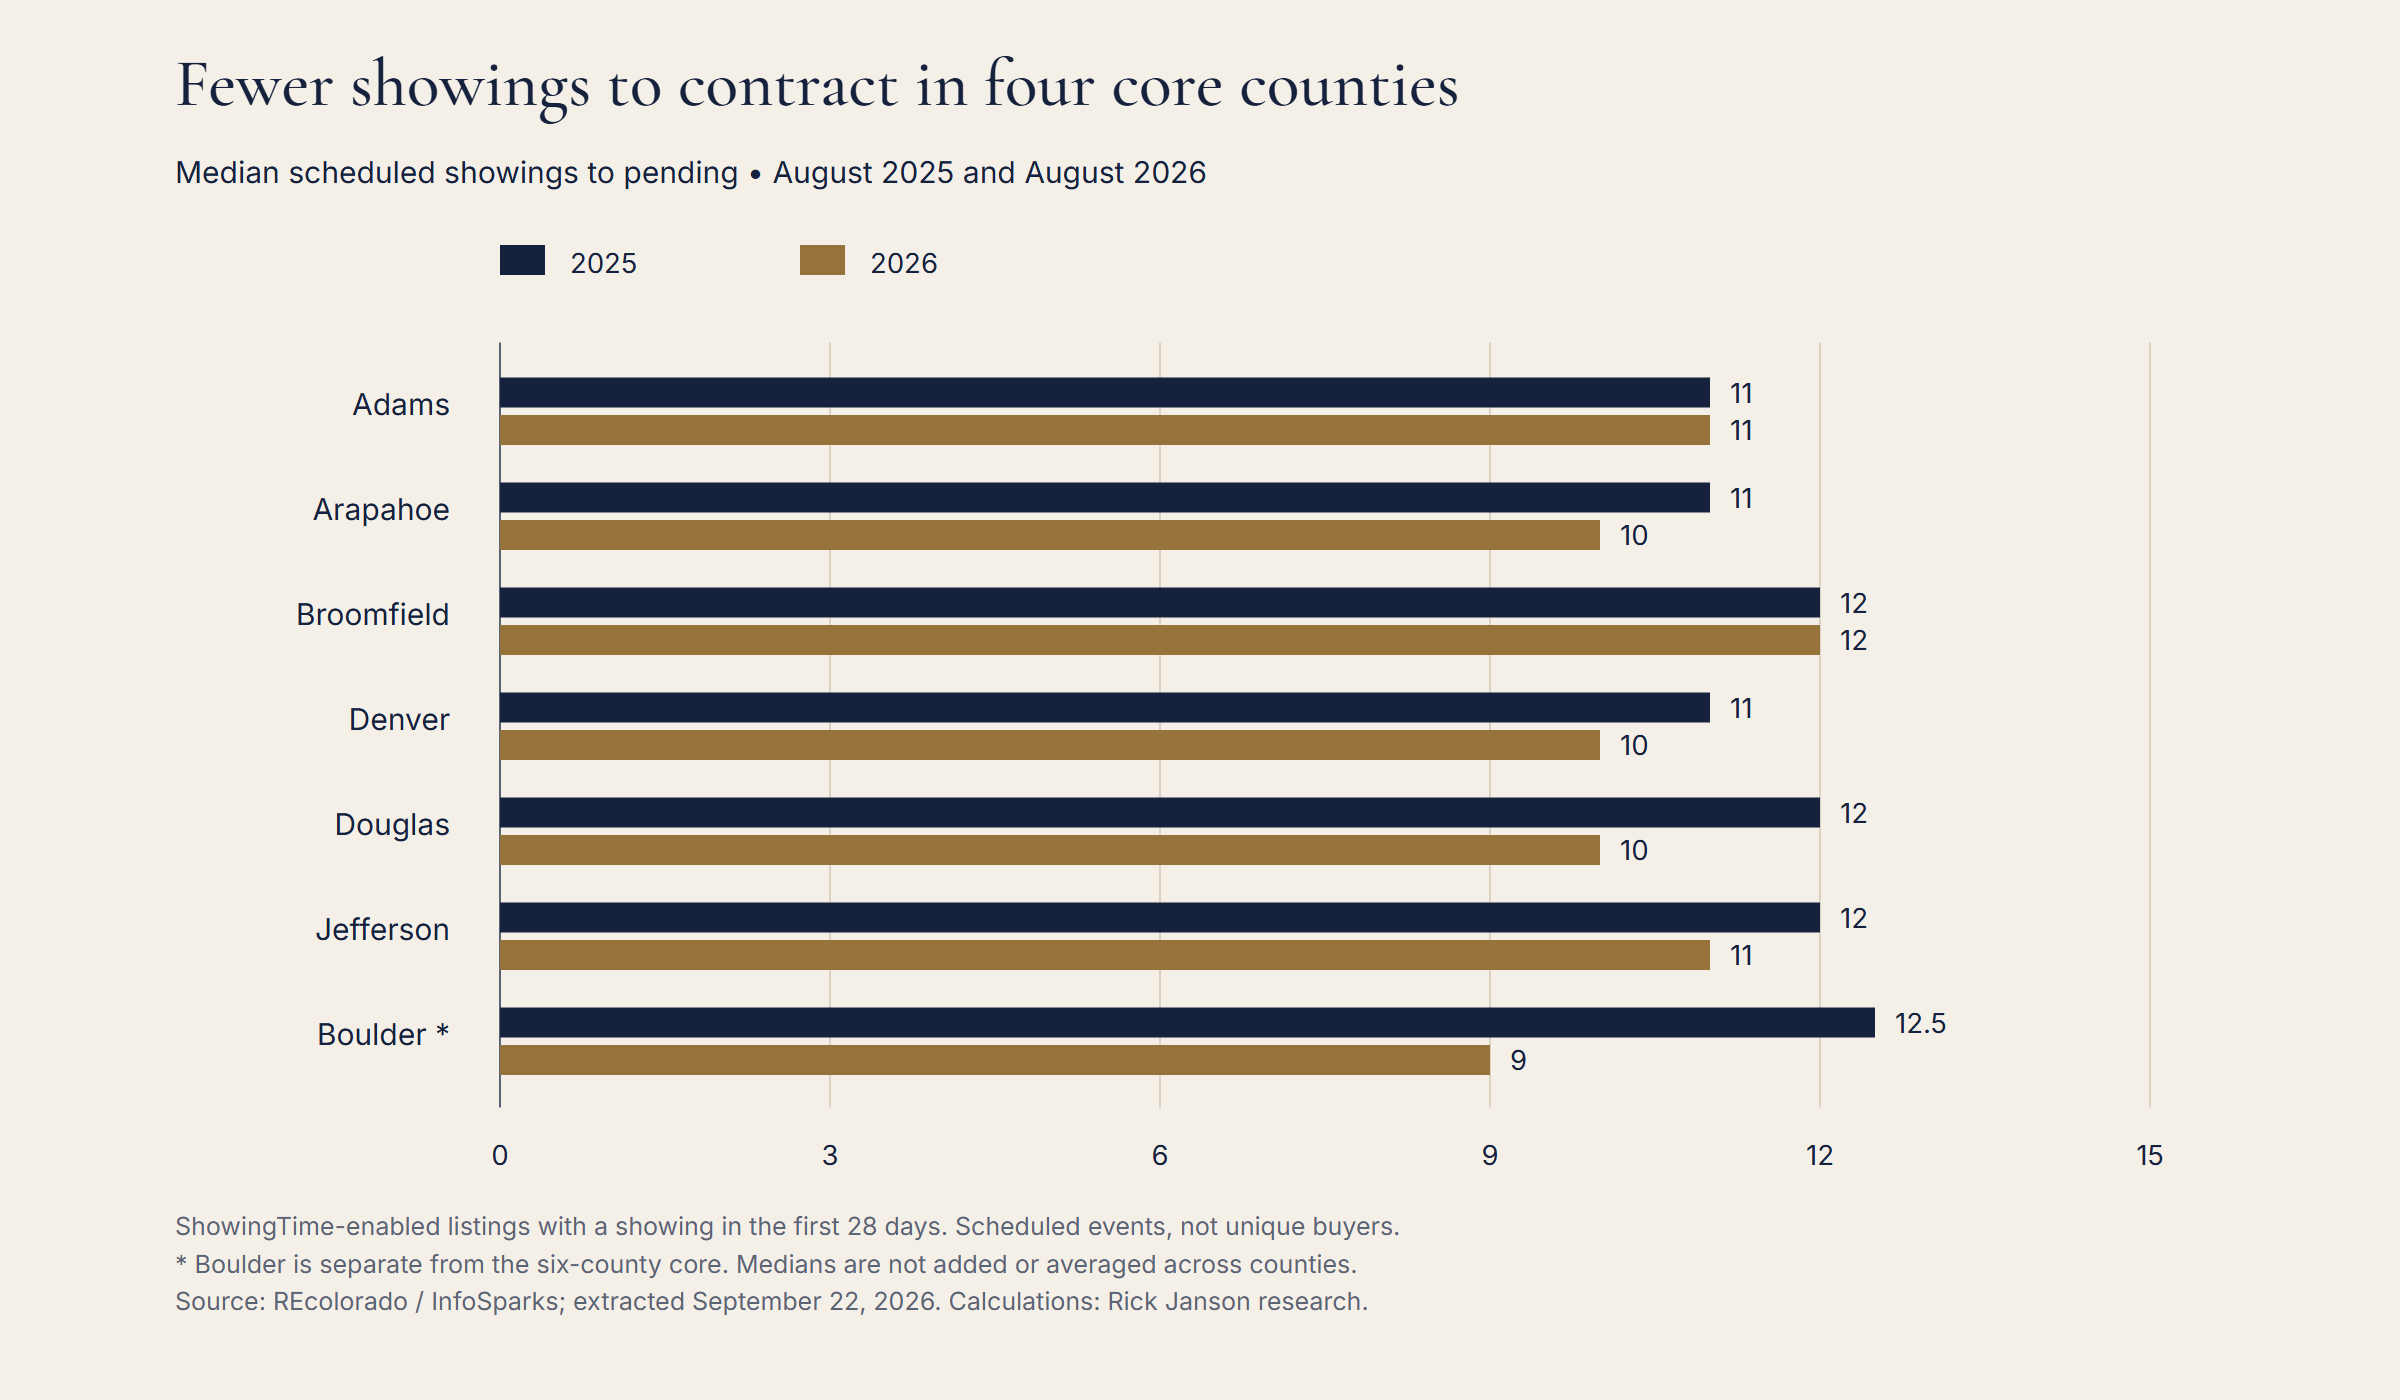
Douglas had the largest reduction among core counties, from 12 to 10 showings, a difference of two in the reported medians. Its accepted-contract count nevertheless fell 21.7%, from 646 to 506. The showing median alone would not reveal that decline in overall contract activity.
Arapahoe and Denver each moved from 11 to 10 showings. Their accepted-contract counts declined 7.7% and 13.5%, respectively. Jefferson moved from 12 to 11 showings, with contracts down 3.3%.
Adams remained at 11 median showings while accepted contracts declined 14.3%. Broomfield remained at 12 while accepted contracts increased 17.7%. An unchanged showing median can therefore accompany quite different volume patterns.
Boulder is a separate comparison. Its median fell from 12.5 to 9, while accepted contracts fell 15.2%. A fractional median is a summary statistic, not a claim that an individual property experienced half a showing. Boulder does not enter the four-of-six core finding.
Which county repeated the decline across all three summer months?
Jefferson was the only core county with a lower showing median in each of June, July and August 2026 than in the corresponding 2025 month. Its sequence was 9 versus 10, 10 versus 11, and 11 versus 12.
Scroll horizontally to see all columns.
| County | June 2025 | June 2026 | July 2025 | July 2026 | Aug. 2025 | Aug. 2026 |
|---|---|---|---|---|---|---|
| Adams | 10 | 10 | 10 | 10 | 11 | 11 |
| Arapahoe | 10 | 10 | 11 | 10 | 11 | 10 |
| Broomfield | 9 | 11 | 10 | 11.5 | 12 | 12 |
| Denver | 9 | 9 | 10 | 9 | 11 | 10 |
| Douglas | 9 | 10 | 10 | 10 | 12 | 10 |
| Jefferson | 10 | 9 | 11 | 10 | 12 | 11 |
| Boulder (separate) | 10 | 9 | 9 | 9 | 12.5 | 9 |
Each pair is a separate monthly comparison. The figures are not added or averaged into a summer median.
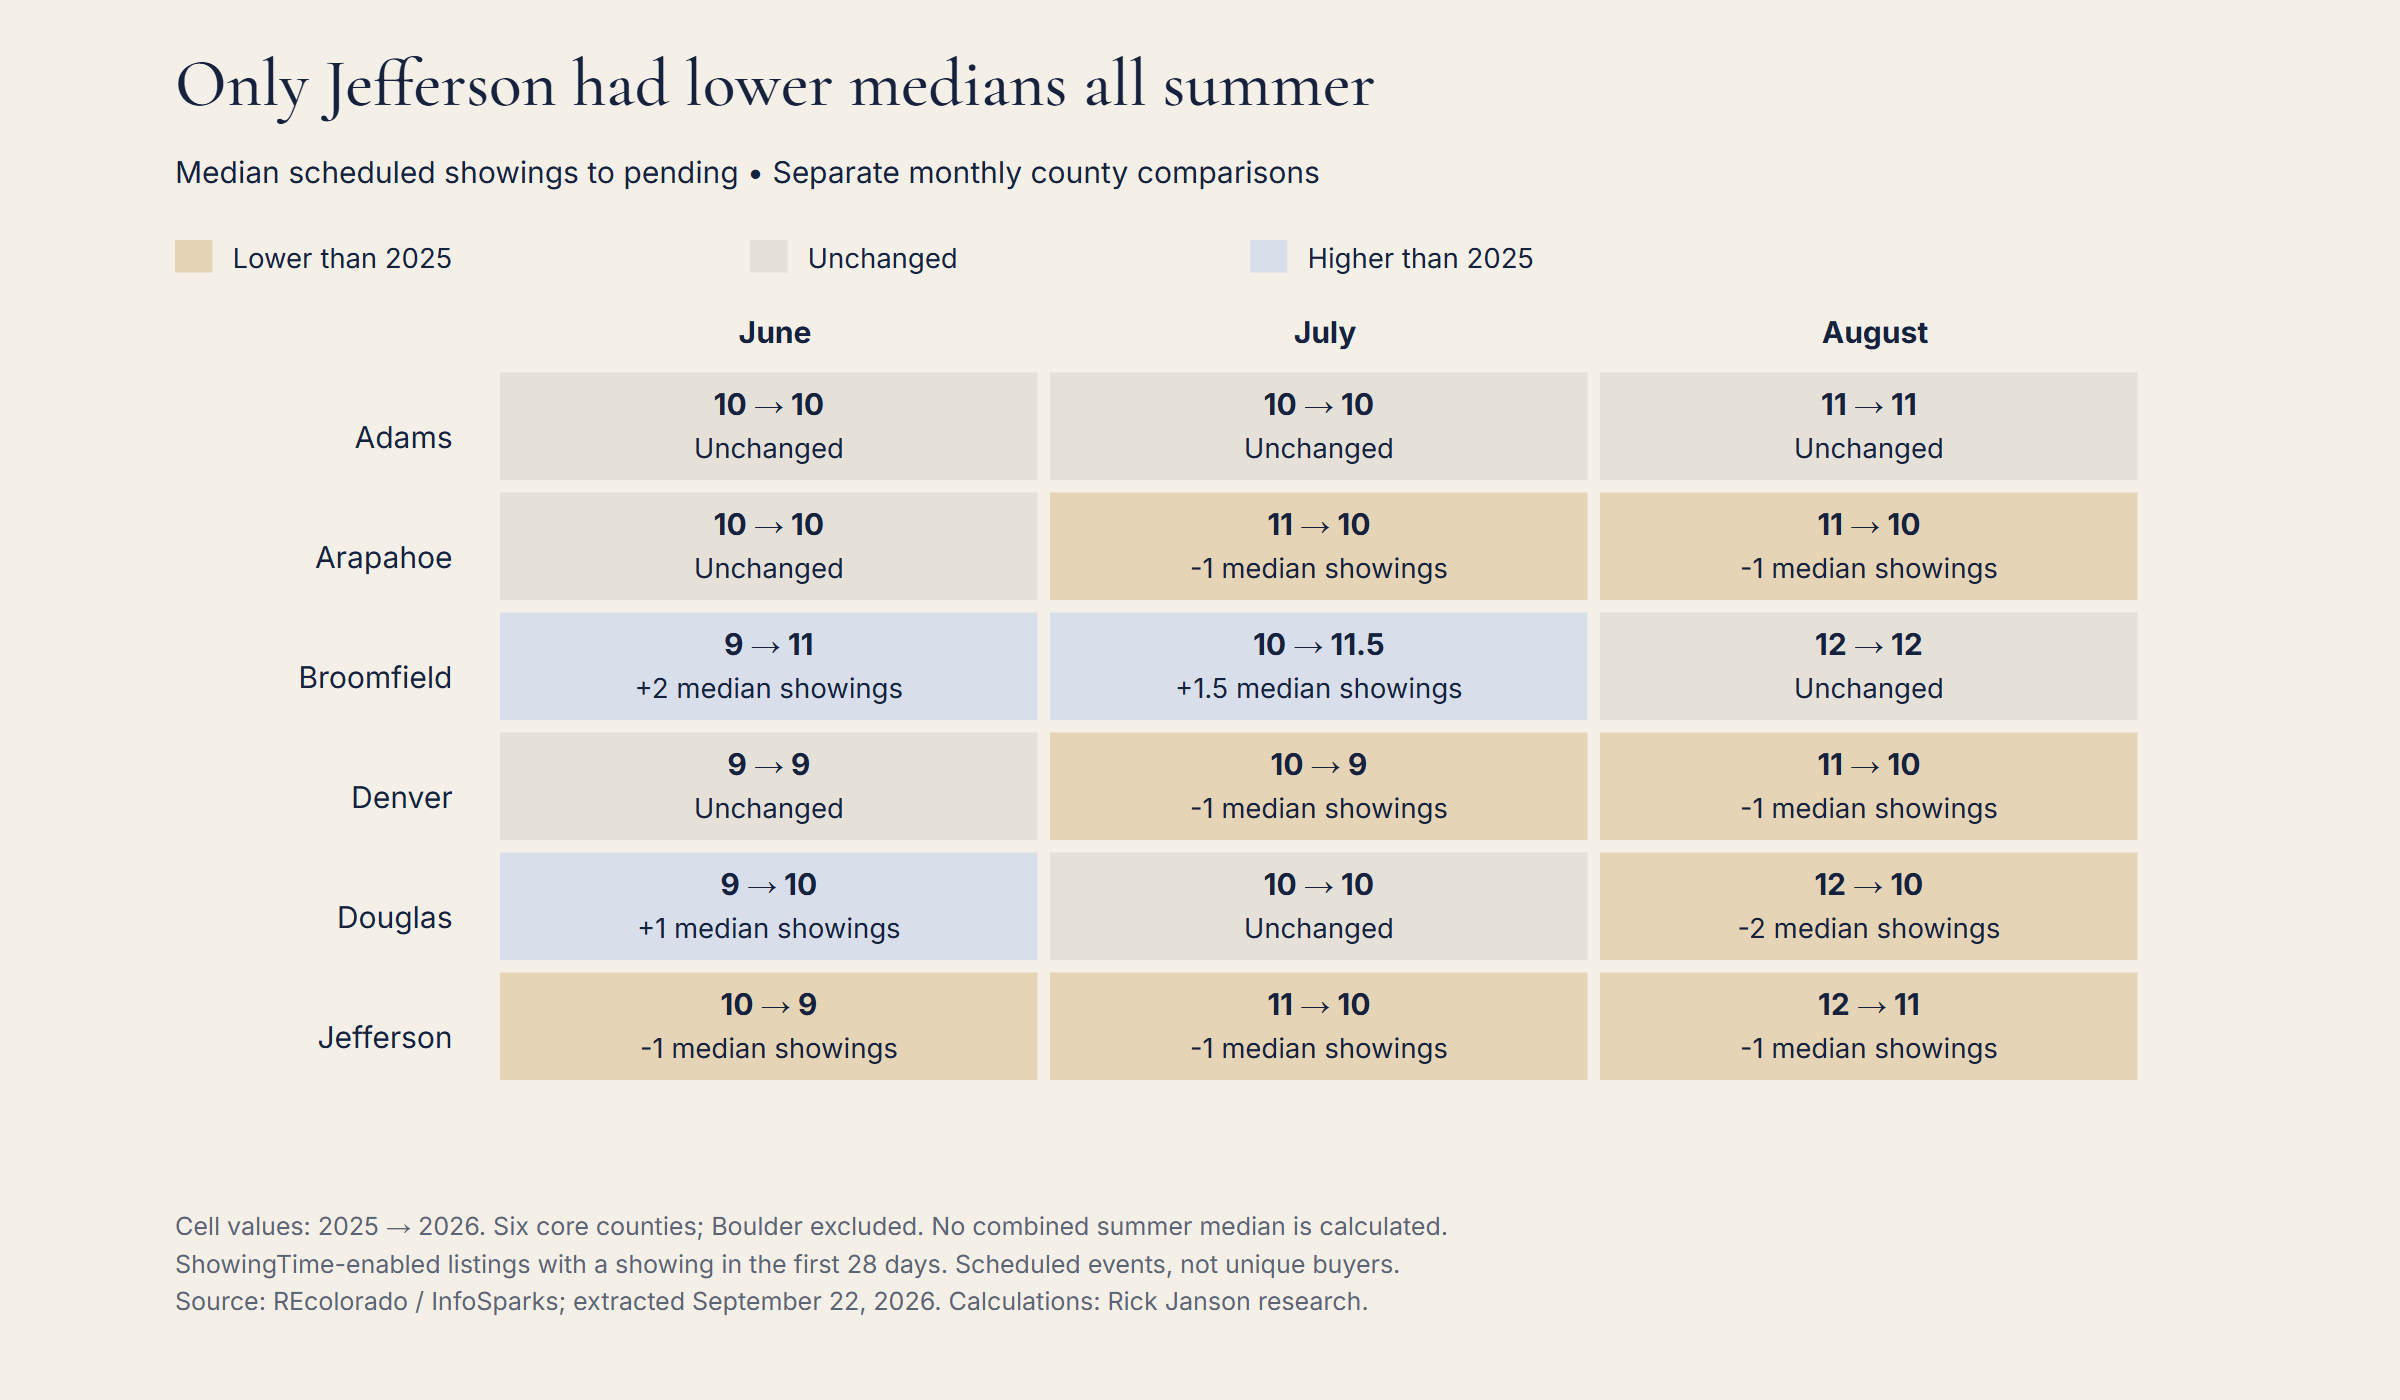
Arapahoe and Denver had unchanged showing medians in June, followed by lower medians in July and August. Douglas had a higher median in June, an unchanged median in July and a lower median in August. Adams was unchanged in all three months. Broomfield was higher in June and July, then unchanged in August.
Jefferson also recorded fewer accepted contracts in all three of those months. That supports a repeated co-occurrence of lower showing medians and lower contract activity. It does not establish that fewer showings caused the lower volume or that a common set of listings underlies both statistics.
What does the ShowingTime coverage rule change?
The InfoSparks manual restricts this showing metric to listings enabled for ShowingTime that have a showing in their first 28 days. That qualification matters when the intended question is how much effort it takes to sell any home in the county.
Listings outside that coverage rule are not represented by this median. A property without a showing during the initial 28-day period can have a very different experience, yet this particular metric cannot describe it. The source exports do not provide the eligible sample size or an all-listing showing distribution.
It is also not a count of unique people. A scheduled showing is an event. These exports do not identify repeat visitors, buyer households or how many people ultimately made an offer. Dividing the county contract count by the showing median would not create a valid conversion rate.
Does fewer showings mean homes became easier to sell?
The data supports a narrower statement: the middle scheduled-showing count for the eligible subset was lower in four core counties. The reasons could involve which properties reached contract, how they were priced, buyer behavior or other changes. Those possibilities require listing-level evidence that this export does not contain.
Marketing time adds another dimension. The August median Days in MLS was lower than a year earlier in all six core counties, but five counties had fewer accepted contracts. A lower showing median and a shorter timing median can coexist with weaker activity counts. Neither median describes the full unsold inventory.
For a property-specific conversation, the useful follow-up is to examine that listing's actual showing history, days on market, comparable properties and offer feedback. The county median supplies context, not a promised number of showings before an offer.
Common questions about showings before a contract
What was Denver County's median in August 2026?
The source reported 10 scheduled showings to pending, down from 11 in August 2025, for the eligible ShowingTime subset. This is Denver County, not a pooled metropolitan median.
Were fewer showings recorded in every county?
No. Four core county medians were lower; Adams and Broomfield were unchanged. Boulder, considered separately, was lower.
Can this report measure how many buyers toured each property?
No. Scheduled showing events are not unique buyers, and individual listing or visitor records are absent.
Why not calculate a metro average or a summer median?
The exports contain county monthly medians. Combining those medians, even with contract-count weights, would not reconstruct the median of the eligible individual showing records.
For related local evidence, see Denver Housing Market, August 2026: More Listings, Fewer Contracts, Denver Housing Inventory Is 88% Above 2023, but Flat Year Over Year, Denver Homes Sell Near Asking Even as Four County Price Medians Fall, Denver Home-Price Measures Disagree in Half of Core Counties, and Fewer Contracts, Shorter Marketing Times in Five Denver-Area Counties. For a buyer or seller evaluating a specific home, comparable properties and the listing's circumstances provide the relevant evidence.
Methodology and source evidence
This edition uses 6 unchanged REcolorado / InfoSparks Monthly CSV exports covering 3 metrics, seven counties and 44 months, January 2023–August 2026. The core research geography is Adams, Arapahoe, Broomfield, Denver, Douglas and Jefferson. Boulder is outside all core totals. The combined filters include all residential property subtypes and price ranges; this is not a luxury-only or detached-only study and does not claim an official MSA boundary.
All 132 overlapping Jefferson County values matched and were deduplicated, leaving 924 unique source values. The extracted metrics are Median Days in MLS, Median Showings to Pending, Pending Listings. The source vintage is September 22, 2026. Historical values can change in later exports.
Annual percentage changes compare the same calendar month or explicitly matched multi-month window: (current / prior − 1) × 100. Counts may be summed across distinct counties and periods; monthly activity sums are not deduplicated unique buyers or households. County or monthly medians are never pooled or averaged into broader medians. Ratios and shares use their stated numerators and denominators. Changes in percentages are expressed in percentage points where appropriate.
The analysis is descriptive. It does not establish causes, individual-home outcomes or statistical significance. Each metric's coverage and the additional limits explained above govern its interpretation. No new live-data refresh was performed for this edition.
Download the supporting tables
Metric definitions: InfoSparks manual, which may require login. Public source context: REcolorado market trends.
Suggested citation: Janson, Rick. “Fewer Showings Before Contract in Four Denver-Area Counties.” Denver Showing Effort Monitor, Report No. 6, August 2026 edition. Calculations from REcolorado / InfoSparks monthly county exports, extracted September 22, 2026. Published September 22, 2026. https://www.rickjanson.com/research/denver-showing-effort/2026-08/
Based on information from REcolorado®, Inc. for the period January 1, 2023 through August 31, 2026.
REcolorado statistical-publication policy, Section 12.0. Underlying MLS content remains subject to the source's rights and terms.
Talk it through
Need a property-specific comparison?
Compare recent sales, current competition and the relevant details for your property.
Request a review of comparable sales for your property.