

August 2026 research edition
Adams Gained Denver-Area Sales Share Even as Its Closings Fell

Published
Data through ; extracted .
Adams County gained share of Denver-area closings in August 2026 even though its own closing count fell. It accounted for 17.93% of the six-county core's completed sales, up from 16.96% a year earlier, while its reported closings declined from 592 to 559.
Broomfield was the only core county with both a higher share and more closings. Its count rose from 69 to 92. The distinction between share and growth is the subject of this original comparison of REcolorado / InfoSparks county statistics.
Which counties gained a larger share of sales?
Adams and Broomfield gained transaction share in the August comparison. Their percentage-point gains were similar, but the underlying volume changes were different: Adams lost 33 closings, while Broomfield gained 23.
Scroll horizontally to see all columns.
| County | 2025 closings | 2026 closings | Count annual change | 2025 share | 2026 share | Share change |
|---|---|---|---|---|---|---|
| Adams | 592 | 559 | -5.6% | 16.96% | 17.93% | +0.97 pp |
| Arapahoe | 745 | 641 | -14.0% | 21.35% | 20.56% | -0.79 pp |
| Broomfield | 69 | 92 | +33.3% | 1.98% | 2.95% | +0.97 pp |
| Denver | 721 | 620 | -14.0% | 20.66% | 19.88% | -0.77 pp |
| Douglas | 633 | 554 | -12.5% | 18.14% | 17.77% | -0.37 pp |
| Jefferson | 730 | 652 | -10.7% | 20.92% | 20.91% | -0.01 pp |
Shares divide each county's closed-listing count by the six-county total. A share change is measured in percentage points. Figures may not sum exactly after display rounding.
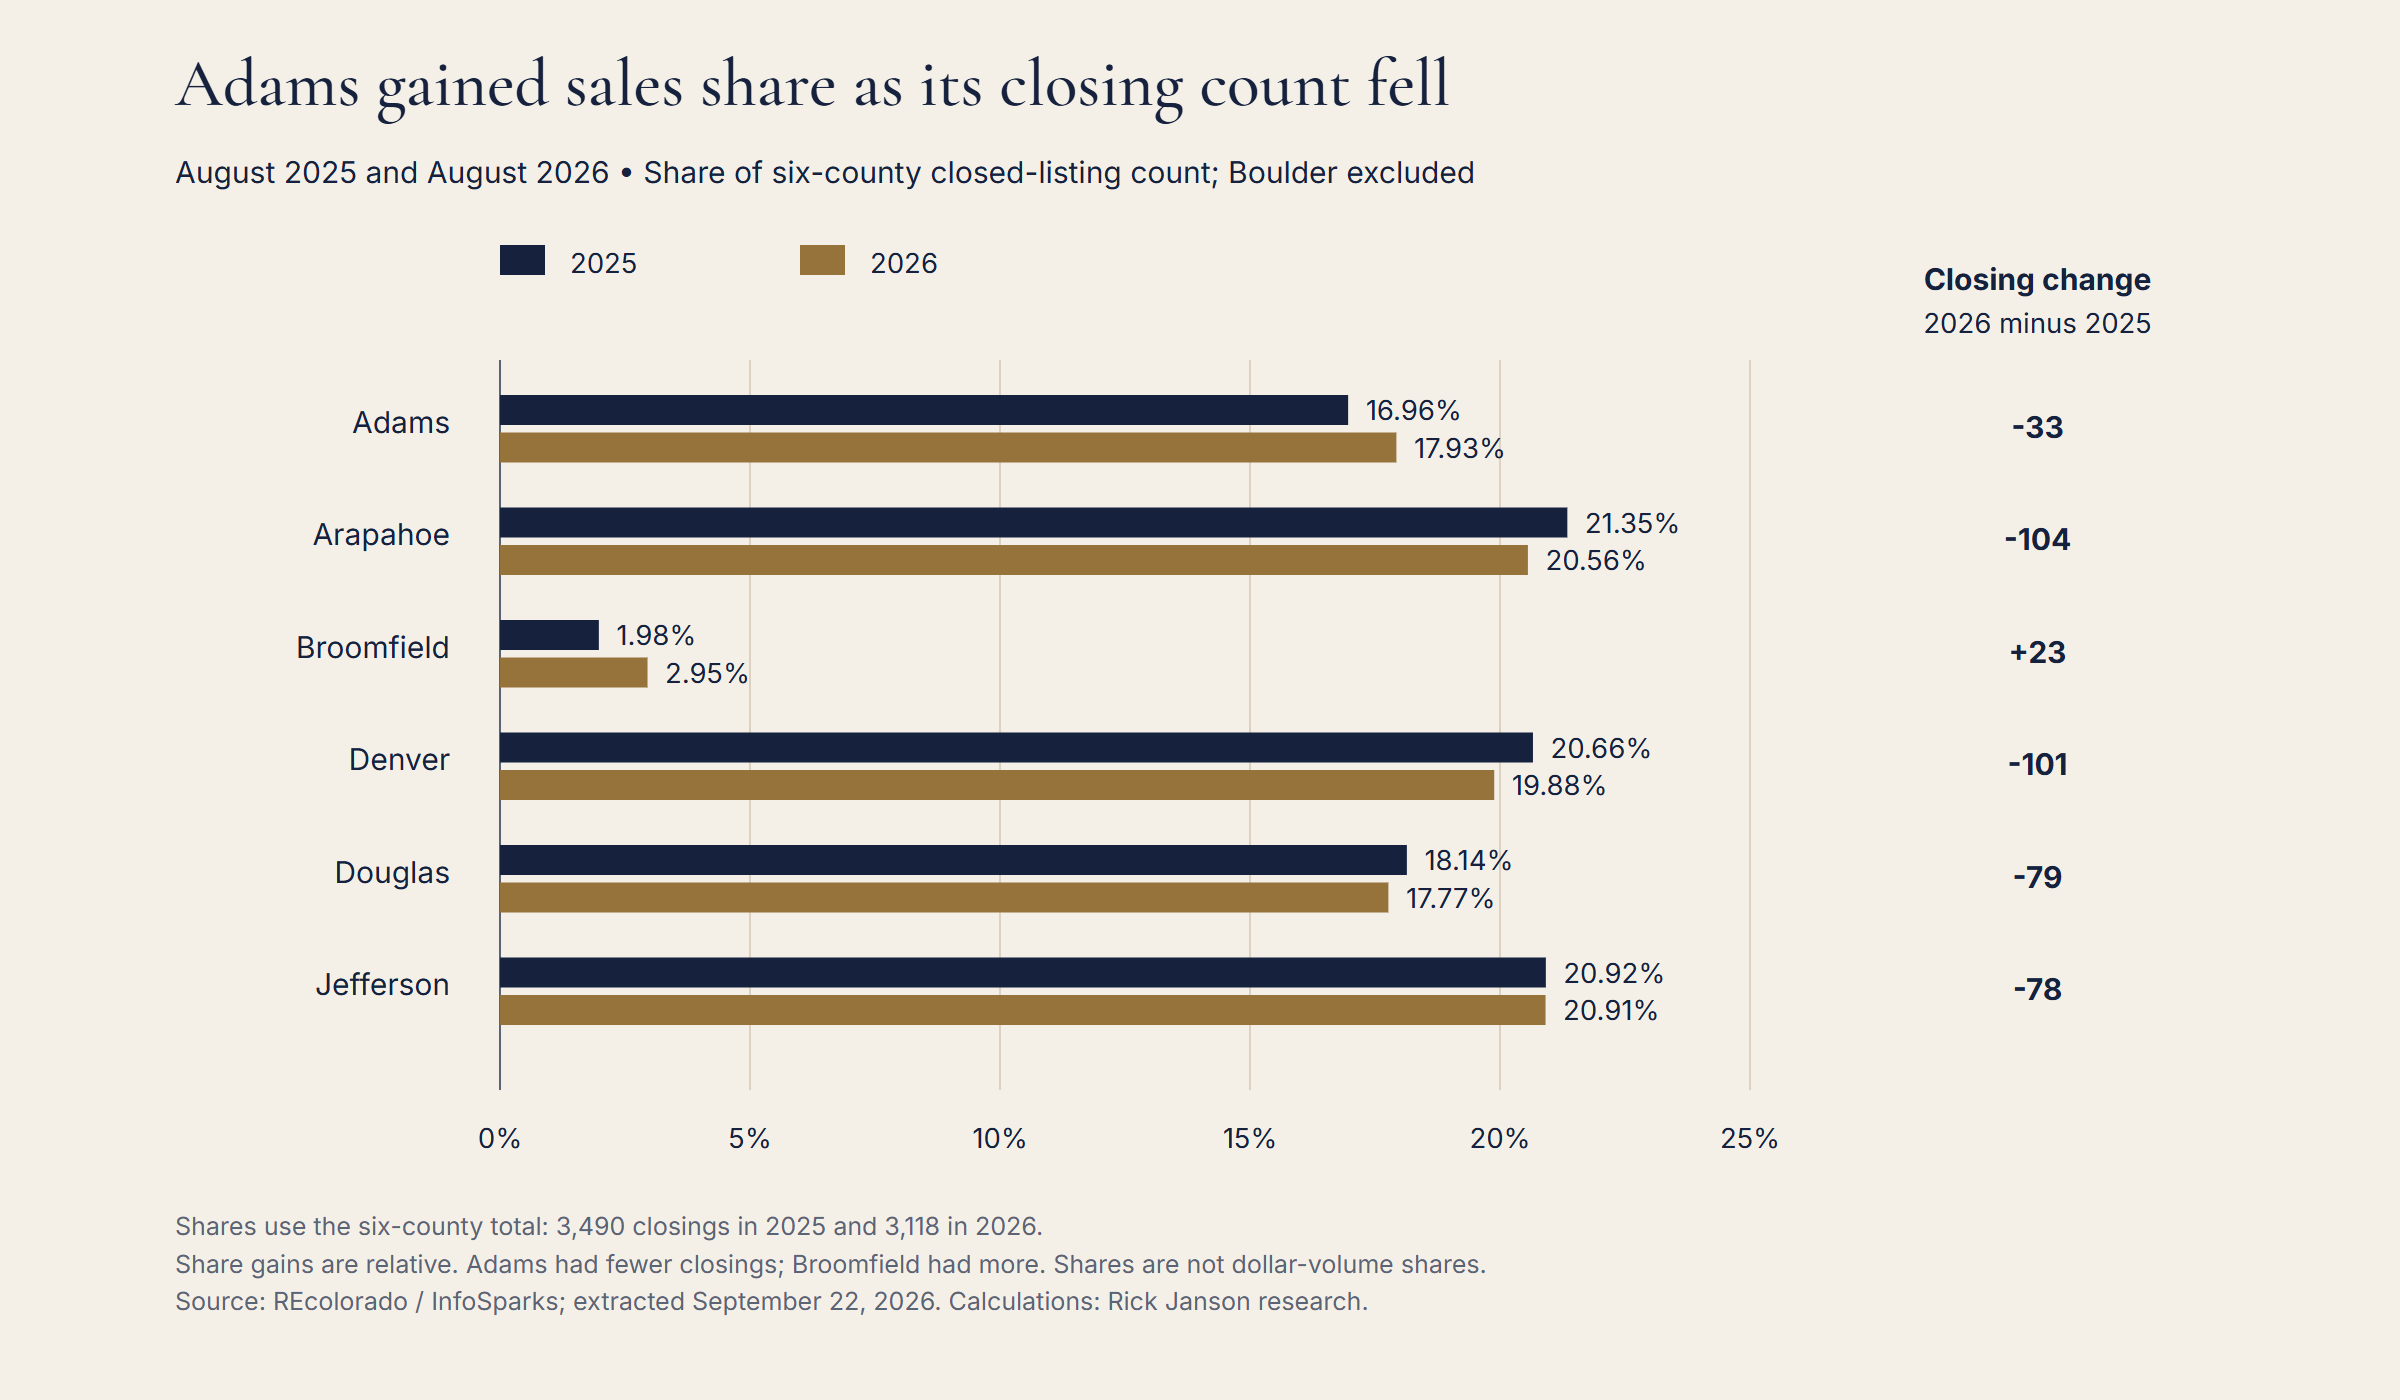
The core total declined from 3,490 to 3,118, down 372 closings or 10.7%. Adams's own decline, at 5.6%, was smaller than the decline in that denominator. Its share therefore increased without any increase in its closing count.
Broomfield's share rose from 1.98% to 2.95%, an increase of 0.97 percentage points. Its 33.3% volume increase started from a relatively small base of 69 closings. Keeping the absolute counts beside the percentage avoids presenting that growth as a large share of the regional market.
Jefferson held the largest August share
Jefferson accounted for 20.91% of August 2026 core closings, narrowly ahead of Arapahoe at 20.56% and Denver at 19.88%. A year earlier, Arapahoe's 21.35% share exceeded Jefferson's 20.92%.
Jefferson's share was nearly unchanged, declining by about 0.006 percentage point before rounding, even though its closing count fell from 730 to 652. Its 10.7% volume decline closely matched the core's decline. A stable share can therefore coexist with substantially fewer transactions.
This does not show a permanent change in county rankings or identify the most desirable location. It describes one month's share of the defined geography's completed-sales count.
What caused the total count to decline mathematically?
The county contributions reconcile exactly. Five core counties lost a combined 395 closings, while Broomfield's 23 additional closings offset part of that loss. The net decline was 372.
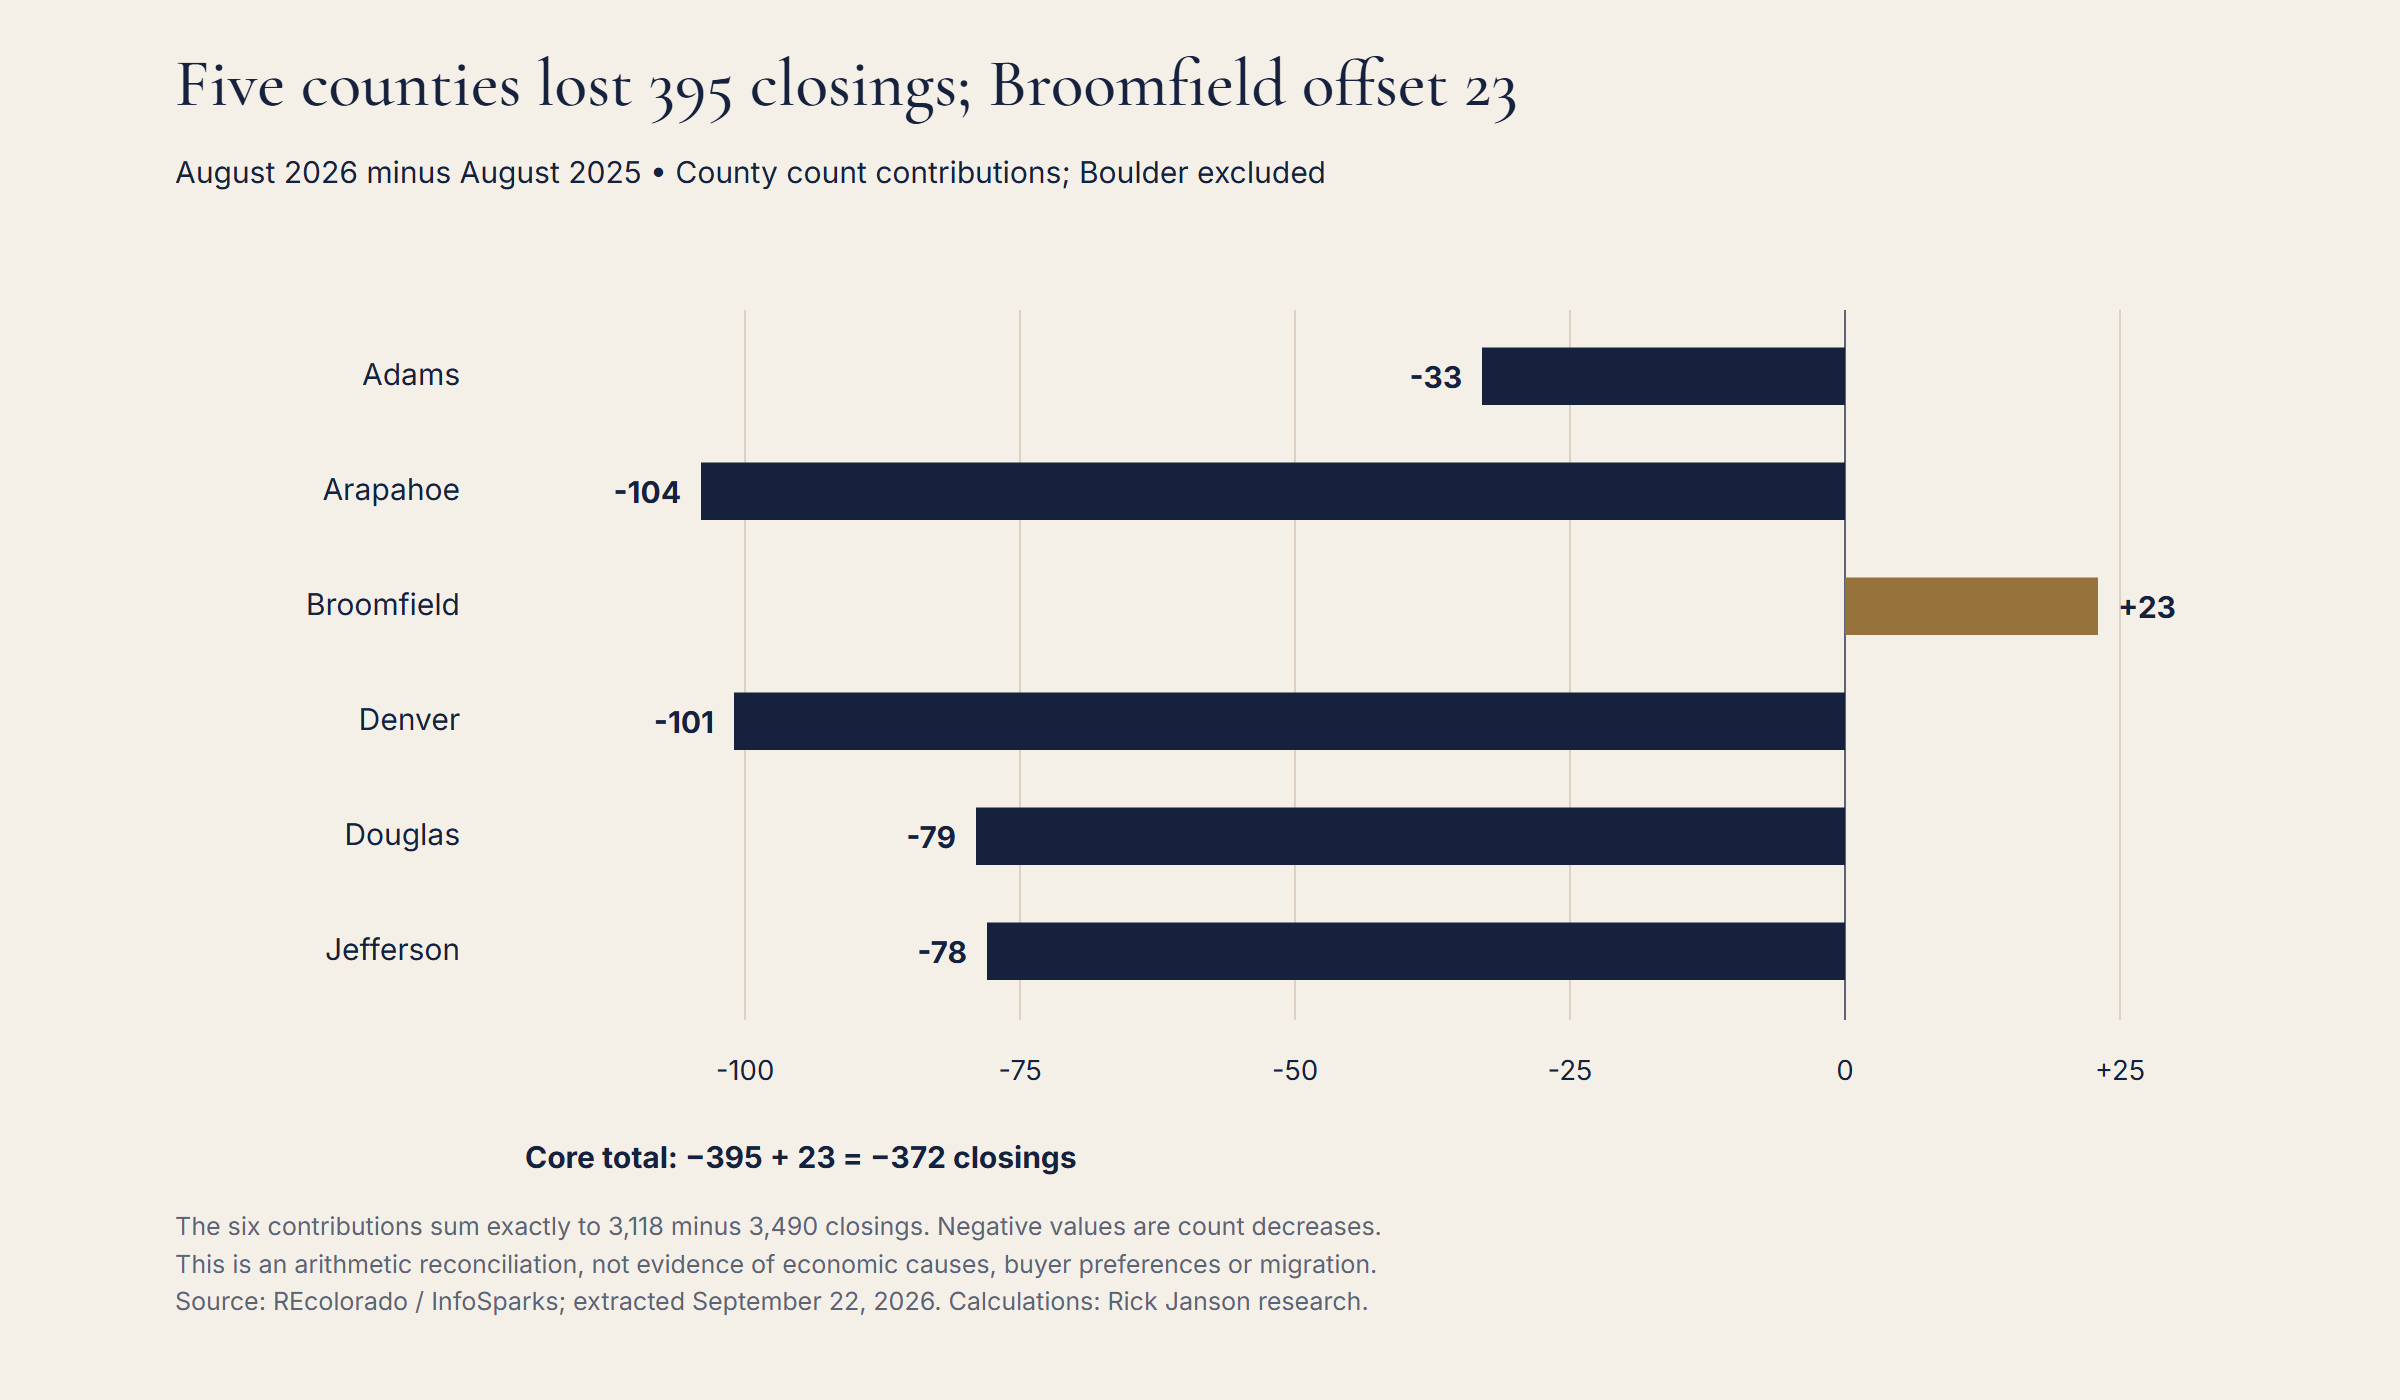
Arapahoe contributed 104 fewer closings, Denver 101 fewer, Douglas 79 fewer, Jefferson 78 fewer and Adams 33 fewer. These are count contributions, not percentages and not evidence of economic causes. They show where the reported numerical change occurred.
Boulder's closing count fell from 395 to 319, down 19.2%. Boulder is a separately tracked comparison and is excluded from the six-county denominator and the 372-closing reconciliation. The downloadable county table therefore leaves Boulder share fields blank rather than assigning it a share of a region it does not belong to.
Does the three-month view tell the same story?
Across June–August 2026, the core recorded 10,819 closings, compared with 11,204 in the matching 2025 period. That is a 3.4% decline, smaller than August's individual annual decline.
Scroll horizontally to see all columns.
| County | 2025 closings | 2026 closings | Count annual change | 2025 share | 2026 share | Share change |
|---|---|---|---|---|---|---|
| Adams | 1,862 | 1,850 | -0.6% | 16.62% | 17.10% | +0.48 pp |
| Arapahoe | 2,393 | 2,267 | -5.3% | 21.36% | 20.95% | -0.40 pp |
| Broomfield | 276 | 299 | +8.3% | 2.46% | 2.76% | +0.30 pp |
| Denver | 2,436 | 2,306 | -5.3% | 21.74% | 21.31% | -0.43 pp |
| Douglas | 1,919 | 1,877 | -2.2% | 17.13% | 17.35% | +0.22 pp |
| Jefferson | 2,318 | 2,220 | -4.2% | 20.69% | 20.52% | -0.17 pp |
| Boulder (separate) | 1,261 | 1,221 | -3.2% | Not applicable | Not applicable | Not applicable |
Three-month shares are calculated from summed county closing counts divided by summed core closing counts. They are not averages of the three monthly shares.
Adams and Broomfield also gained share in the three-month view. Douglas gained share over that longer window despite fewer closings, even though it lost share in the August-only comparison. Its summer count fell from 1,919 to 1,877, a smaller percentage decline than the core total.
That difference is a useful reason to show both periods. A monthly share shift and a matched three-month share shift are related summaries, but they are not interchangeable findings.
What does sales share say about buyer preferences?
It identifies where the recorded closings occurred within the selected counties. It does not identify where buyers previously lived, why they chose a home, how much they spent in total or whether they preferred one county over another.
Transaction count also gives every closing one unit of weight. It is not dollar-volume share: a lower-priced closing and a higher-priced closing each count once. This all-residential dataset does not isolate luxury transactions or buyer wealth.
For agents and market observers, the practical value is in separating three questions: how many closings occurred, how much that count changed and what share of the core total the county represented. A statement about one should not silently substitute for another.
Common questions about Denver-area sales share
Which county had the highest August 2026 share?
Jefferson, with 652 of 3,118 core closings, or 20.91%. Arapahoe followed with 641 closings and 20.56%. These shares apply only to the six-county research area.
Can a county gain share while sales fall?
Yes. Adams illustrates that pattern: its closing count fell 5.6%, while the core total fell 10.7%, increasing its relative share.
Was Broomfield the only county with more closings?
Yes, among the six core counties in the August year-over-year comparison. Its count increased by 23, from 69 to 92. Boulder separately declined.
Do these figures show people moving from Denver to Adams?
No. The data has no buyer-origin or household-migration records. A transaction-share change cannot establish such a movement.
For related local evidence, see Denver Housing Market, August 2026: More Listings, Fewer Contracts, Denver Housing Inventory Is 88% Above 2023, but Flat Year Over Year, Denver Homes Sell Near Asking Even as Four County Price Medians Fall, Denver Home-Price Measures Disagree in Half of Core Counties, Fewer Contracts, Shorter Marketing Times in Five Denver-Area Counties, and Fewer Showings Before Contract in Four Denver-Area Counties. For a buyer or seller evaluating a specific home, comparable properties and the listing's circumstances provide the relevant evidence.
Methodology and source evidence
This edition uses 2 unchanged REcolorado / InfoSparks Monthly CSV exports covering 1 metric, seven counties and 44 months, January 2023–August 2026. The core research geography is Adams, Arapahoe, Broomfield, Denver, Douglas and Jefferson. Boulder is outside all core totals. The combined filters include all residential property subtypes and price ranges; this is not a luxury-only or detached-only study and does not claim an official MSA boundary.
All 44 overlapping Jefferson County values matched and were deduplicated, leaving 308 unique source values. The extracted metric is Closed Listings. The source vintage is September 22, 2026. Historical values can change in later exports.
Annual percentage changes compare the same calendar month or explicitly matched multi-month window: (current / prior − 1) × 100. Counts may be summed across distinct counties and periods; monthly activity sums are not deduplicated unique buyers or households. County or monthly medians are never pooled or averaged into broader medians. Ratios and shares use their stated numerators and denominators. Changes in percentages are expressed in percentage points where appropriate.
The analysis is descriptive. It does not establish causes, individual-home outcomes or statistical significance. Each metric's coverage and the additional limits explained above govern its interpretation. No new live-data refresh was performed for this edition.
Download the supporting tables
Metric definitions: InfoSparks manual, which may require login. Public source context: REcolorado market trends.
Suggested citation: Janson, Rick. “Adams Gained Denver-Area Sales Share Even as Its Closings Fell.” Where Denver-Area Sales Are Happening, Report No. 7, August 2026 edition. Calculations from REcolorado / InfoSparks monthly county exports, extracted September 22, 2026. Published September 22, 2026. https://www.rickjanson.com/research/denver-sales-share/2026-08/
Based on information from REcolorado®, Inc. for the period January 1, 2023 through August 31, 2026.
REcolorado statistical-publication policy, Section 12.0. Underlying MLS content remains subject to the source's rights and terms.
Talk it through
Need a property-specific comparison?
Compare recent sales, current competition and the relevant details for your property.
Request a review of comparable sales for your property.