

August 2026 research edition
Denver Months of Supply Rose Mostly Through a Slower Contract Pace

Published
Data through ; extracted .
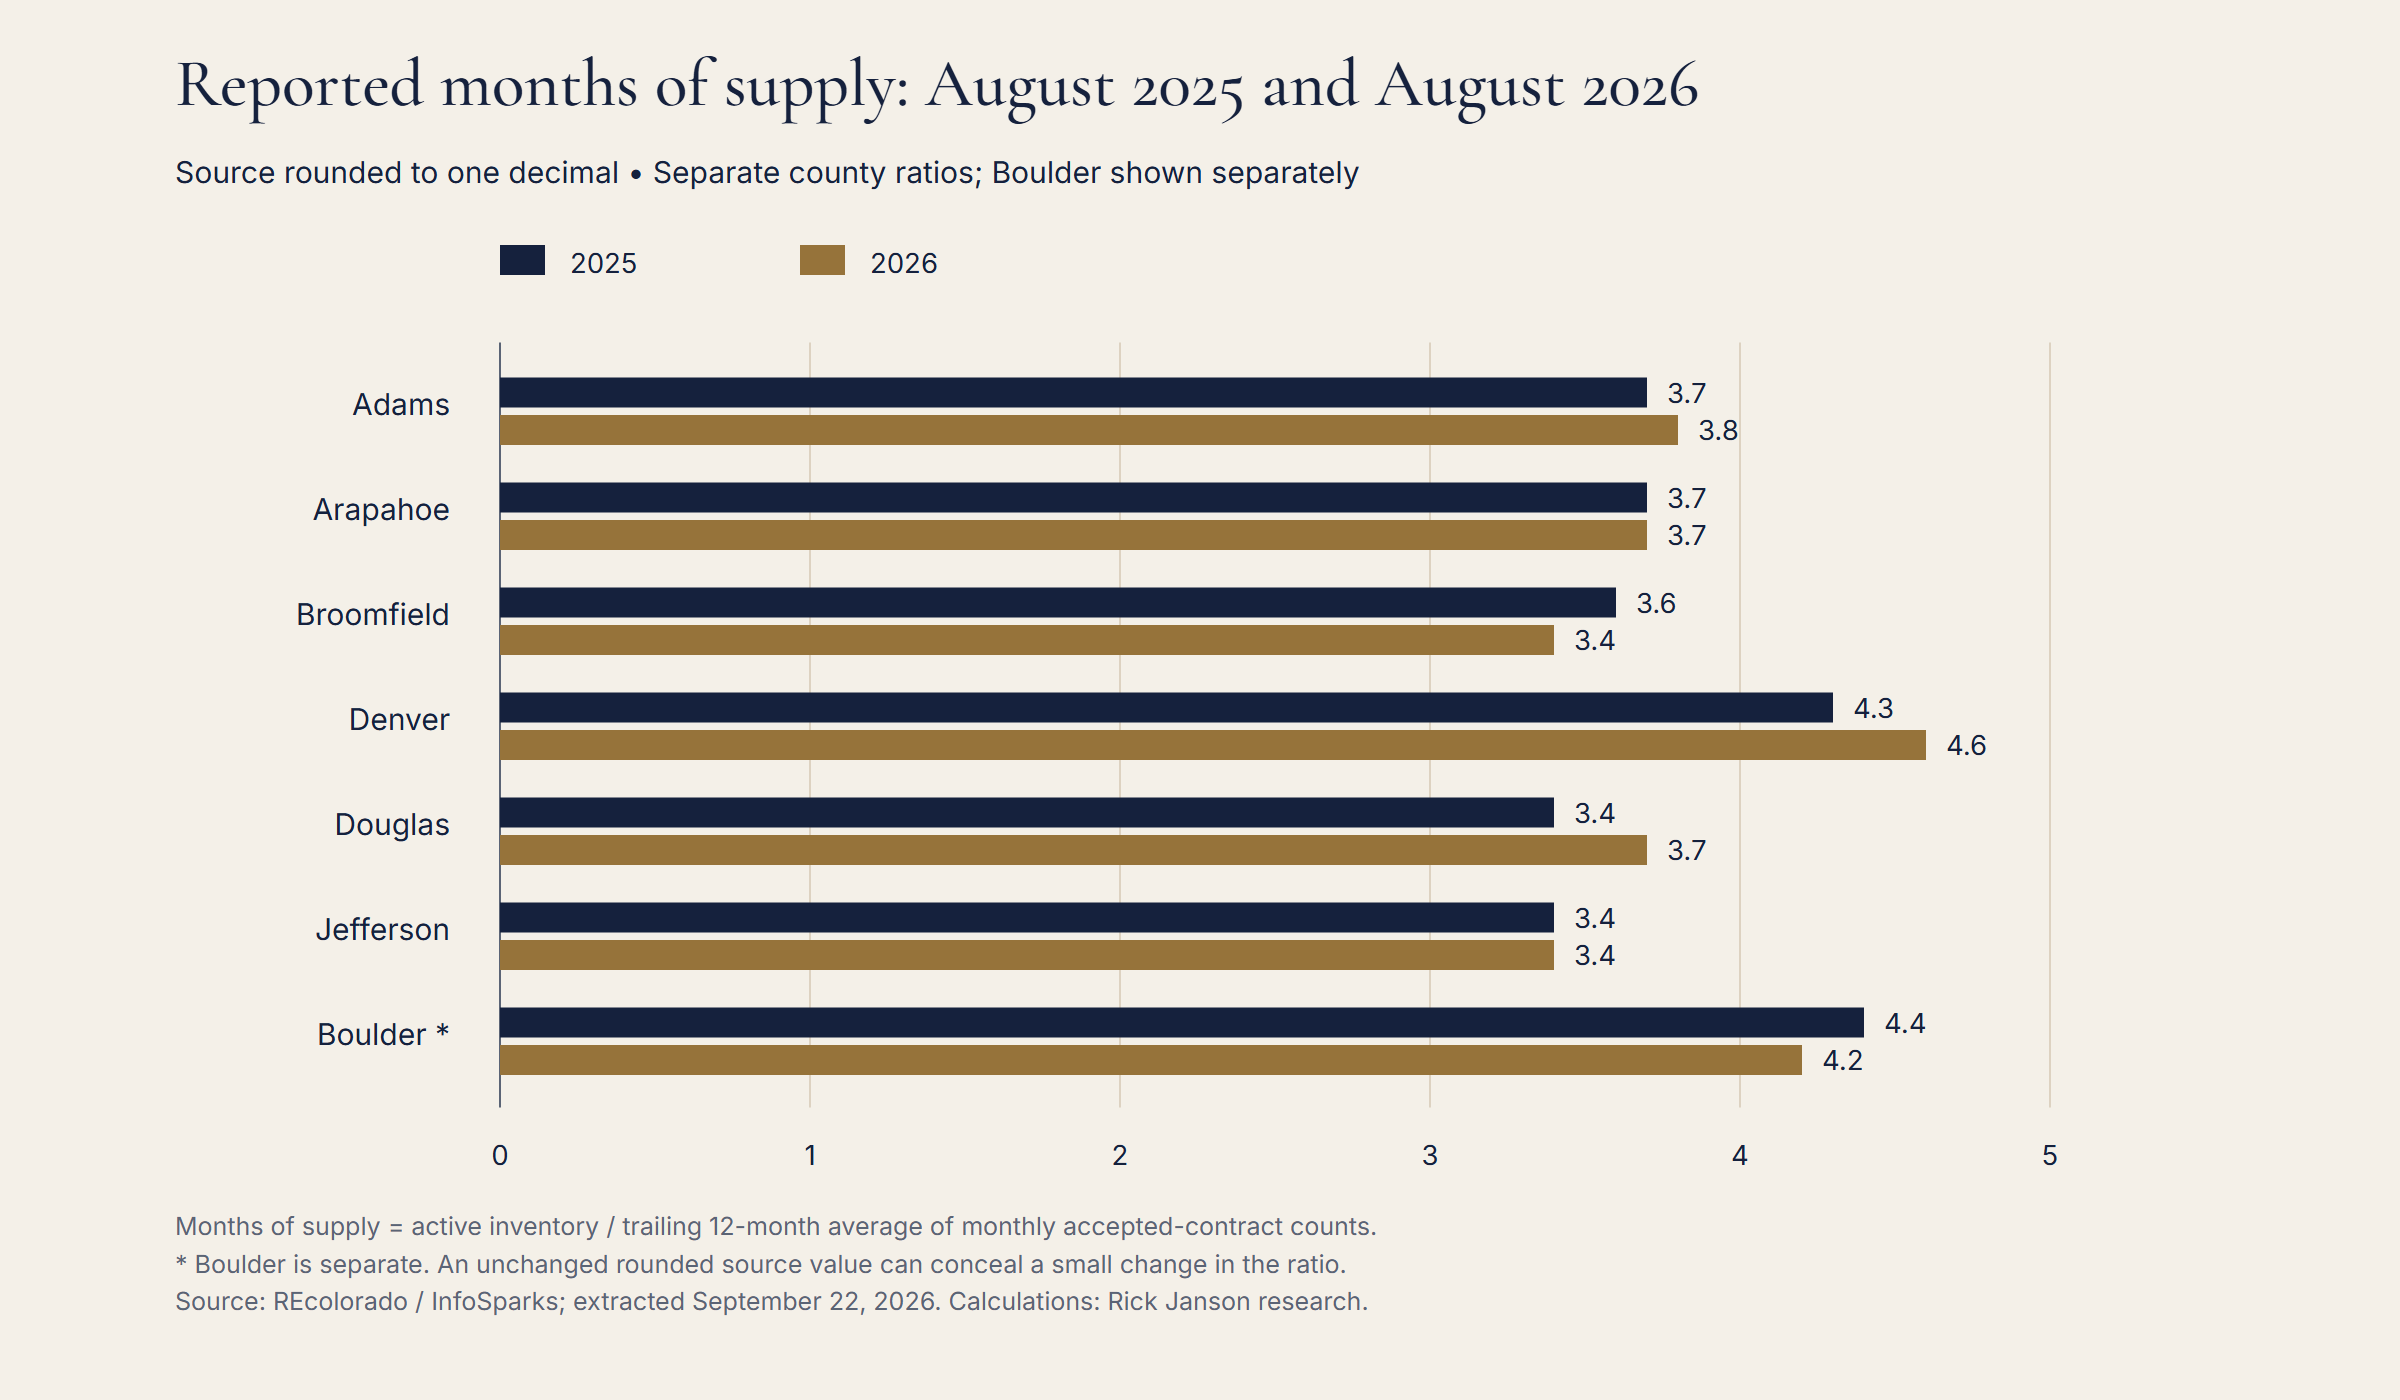
Denver County's reported months of supply increased from 4.3 to 4.6 between August 2025 and August 2026, while active inventory increased just 1.3%. Reconstructing the source formula shows that a lower trailing accepted-contract pace accounts for most of the arithmetic increase. Douglas County shows a similar pattern.
This report separates the two inputs to months of supply: month-end inventory and the average monthly contract count over the trailing 12 months. It also checks the reconstruction against the published source series. All 231 county-month values that could be fully reconstructed were within the source's one-decimal rounding precision.
How does REcolorado's months-of-supply measure work?
The InfoSparks manual defines months of supply as month-end active inventory divided by average monthly accepted-contract activity over the preceding 12-month window, including the current month in this reconstruction. In symbols, months of supply = active listings / (trailing 12 months of pending listings / 12).
That denominator matters. This is not inventory divided by only the latest month's closings, or only the latest month's pending count. A change in the trailing pace can move the ratio even when the number of available listings barely changes.
Scroll horizontally to see all columns.
| County | 2025 active | 2026 active | 2025 monthly pace | 2026 monthly pace | 2025 supply | 2026 supply |
|---|---|---|---|---|---|---|
| Adams | 2,229 | 2,251 | 600.67 | 596.25 | 3.7 | 3.8 |
| Arapahoe | 2,639 | 2,526 | 713.67 | 691.17 | 3.7 | 3.7 |
| Broomfield | 294 | 296 | 82.00 | 87.50 | 3.6 | 3.4 |
| Denver | 3,314 | 3,356 | 765.00 | 732.25 | 4.3 | 4.6 |
| Douglas | 1,934 | 1,960 | 567.08 | 533.75 | 3.4 | 3.7 |
| Jefferson | 2,286 | 2,297 | 681.67 | 672.50 | 3.4 | 3.4 |
| Boulder (separate) | 1,583 | 1,497 | 363.25 | 354.33 | 4.4 | 4.2 |
Reported supply figures are rounded source values. Contract pace is the trailing 12-month pending total divided by 12. Boulder is a separate comparison.
How much of Denver's increase came from each input?
Denver's active inventory rose from 3,314 to 3,356, an increase of 42 listings. Its trailing 12-month accepted-contract total fell from 9,180 to 8,787, lowering the average monthly pace from 765 to 732.25.
The reconstructed supply ratio rose from approximately 4.332 to 4.583 months, an increase of 0.251 month. Using a symmetric arithmetic decomposition, the inventory input contributes about 0.056 month and the contract-pace input about 0.195 month. The latter is approximately 77.6% of the reconstructed increase.
Douglas's active inventory rose from 1,934 to 1,960, while trailing accepted contracts fell from 6,805 to 6,405. Its reconstructed supply ratio increased by approximately 0.262 month. About 0.214 month, or 81.9% of that increase, is assigned to the slower pace input under the same calculation.
Scroll horizontally to see all columns.
| County | Net change, months | Inventory contribution | Pace contribution |
|---|---|---|---|
| Adams | +0.064 | +0.037 | +0.028 |
| Arapahoe | -0.043 | -0.161 | +0.118 |
| Broomfield | -0.203 | +0.024 | -0.226 |
| Denver | +0.251 | +0.056 | +0.195 |
| Douglas | +0.262 | +0.047 | +0.214 |
| Jefferson | +0.062 | +0.016 | +0.046 |
| Boulder (separate) | -0.133 | -0.240 | +0.107 |
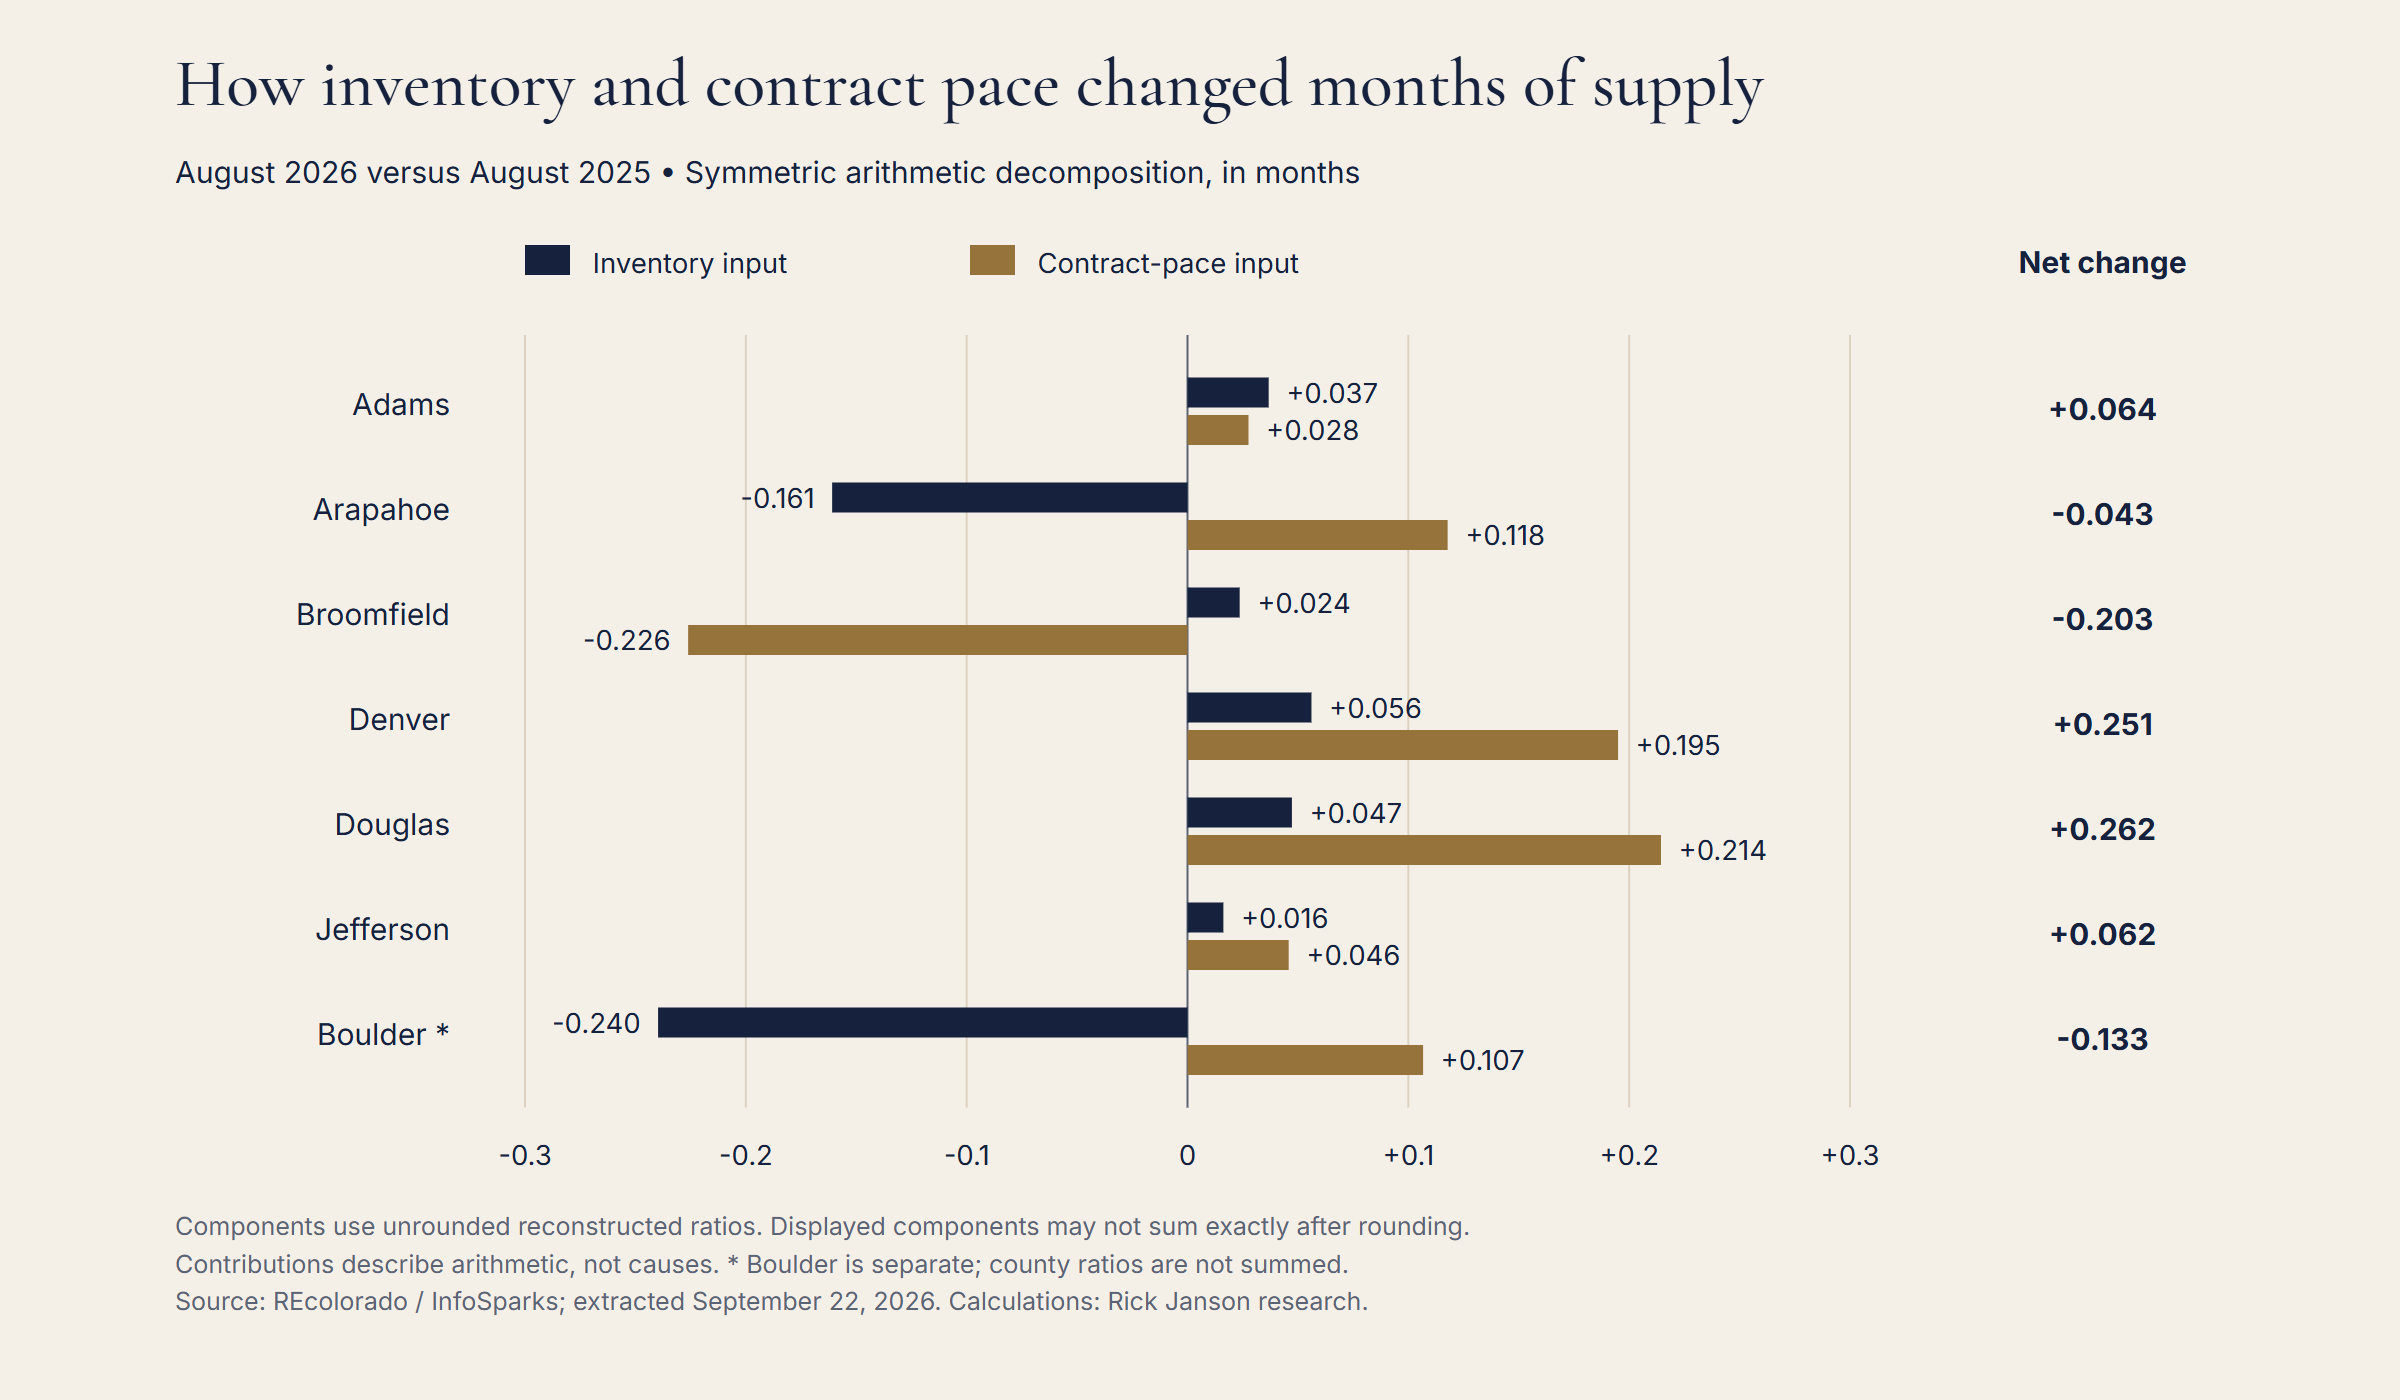
These are contributions to a ratio's arithmetic change. They do not identify why contract activity declined, demonstrate a causal effect of inventory or predict future sales.
Why did Broomfield's supply decline despite more inventory?
Broomfield had 296 active listings in August 2026 versus 294 a year earlier. Yet its reported months of supply declined from 3.6 to 3.4. Its trailing accepted-contract total rose from 984 to 1,050, increasing the monthly average pace from 82 to 87.5.
In the reconstruction, the small inventory increase adds approximately 0.024 month, while the faster contract pace subtracts approximately 0.226 month. The net change is about −0.203 month. The larger denominator more than offsets the slightly larger inventory.
This illustrates why months of supply and inventory should be reported as related but distinct measures. The direction of one does not uniquely determine the direction of the other.
Can rounded supply figures hide a change?
Yes. Arapahoe's reported figure was 3.7 months in both August 2025 and August 2026. Its reconstructed ratio declined slightly, from about 3.698 to 3.655. Both values round to 3.7.
Jefferson also had an unchanged reported figure, 3.4 months in both periods. Its reconstruction increased from approximately 3.354 to 3.416. Those values both round to 3.4. “Unchanged at one decimal” therefore does not imply an exactly unchanged underlying ratio.
The extra decimals in this analysis come from arithmetic on the exported counts. They should not be presented as greater accuracy in the original listing records. Historical revisions or source processing can affect both the counts and the published ratio.
How were the two contributions calculated?
Changing inventory first and pace second assigns their interaction differently than changing them in the opposite order. The report averages those two update orders. Let I0 and I1 be prior and current inventory, and P0 and P1 be the prior and current trailing monthly contract paces.
Inventory contribution is (I1 − I0) × (1/P0 + 1/P1) / 2. Pace contribution is (I0 + I1) × (1/P1 − 1/P0) / 2. Their sum equals I1/P1 − I0/P0 exactly, apart from machine rounding. The components are expressed in months of supply.
This symmetric approach avoids choosing one update order as the answer. It is a transparent way to describe the ratio, not a model of underlying economic causation.
What did the reconstruction check establish?
The source extract begins in January 2023, so December 2023 is the first month with all 12 denominator observations available. From December 2023 through August 2026, 33 observations per county across seven counties produce 231 checks. Every reconstructed value is within 0.05 month of the source's one-decimal value.
That agreement supports consistency with the documented formula and these exports. It is not an independent audit of the original listings because both the source ratio and the reconstruction originate from the same data system.
How can buyers and sellers use this comparison?
Ask for both the active-listing count and trailing contract pace alongside the months-of-supply figure. Use that county context with recent comparable sales, current competing listings and the specific property’s condition and price. The county ratio does not determine the right offer or list price for an individual home.
Common questions about months of supply
Does rising supply always mean more homes are being listed?
No. It can reflect more active inventory, a slower trailing contract pace or both. New listings are a separate activity measure from month-end active inventory.
Can the county ratios be added into a metro total?
No. This report keeps county ratios separate. Summing months of supply would not produce a valid regional ratio.
Does 4.6 months establish a balanced market?
This report does not impose a universal balance threshold. It describes the source ratio and its inputs; it does not infer negotiating conditions for every property from a single cutoff.
Why not use this month's pending count as the denominator?
The source definition uses a trailing 12-month average. Replacing it with one month's activity would calculate a different measure and could substantially change the result.
For related local evidence, see Denver Housing Market, August 2026: More Listings, Fewer Contracts, Denver Housing Inventory Is 88% Above 2023, but Flat Year Over Year, Denver Homes Sell Near Asking Even as Four County Price Medians Fall, Denver Home-Price Measures Disagree in Half of Core Counties, Fewer Contracts, Shorter Marketing Times in Five Denver-Area Counties, Fewer Showings Before Contract in Four Denver-Area Counties, and Adams Gained Denver-Area Sales Share Even as Its Closings Fell. For a buyer or seller evaluating a specific home, comparable properties and the listing's circumstances provide the relevant evidence.
Methodology and source evidence
This edition uses 6 unchanged REcolorado / InfoSparks Monthly CSV exports covering 3 metrics, seven counties and 44 months, January 2023–August 2026. The core research geography is Adams, Arapahoe, Broomfield, Denver, Douglas and Jefferson. Boulder is outside all core totals. The combined filters include all residential property subtypes and price ranges; this is not a luxury-only or detached-only study and does not claim an official MSA boundary.
All 132 overlapping Jefferson County values matched and were deduplicated, leaving 924 unique source values. The extracted metrics are Active Listings, Months Supply of Homes for Sale, Pending Listings. The source vintage is September 22, 2026. Historical values can change in later exports.
Annual percentage changes compare the same calendar month or explicitly matched multi-month window: (current / prior − 1) × 100. Counts may be summed across distinct counties and periods; monthly activity sums are not deduplicated unique buyers or households. County or monthly medians are never pooled or averaged into broader medians. Ratios and shares use their stated numerators and denominators. Changes in percentages are expressed in percentage points where appropriate.
The analysis is descriptive. It does not establish causes, individual-home outcomes or statistical significance. Each metric's coverage and the additional limits explained above govern its interpretation. No new live-data refresh was performed for this edition.
Download the supporting tables
Metric definitions: InfoSparks manual, which may require login. Public source context: REcolorado market trends.
Suggested citation: Janson, Rick. “Denver Months of Supply Rose Mostly Through a Slower Contract Pace.” What Is Moving Denver Months of Supply?, Report No. 8, August 2026 edition. Calculations from REcolorado / InfoSparks monthly county exports, extracted September 22, 2026. Published September 22, 2026. https://www.rickjanson.com/research/denver-months-supply/2026-08/
Based on information from REcolorado®, Inc. for the period January 1, 2023 through August 31, 2026.
REcolorado statistical-publication policy, Section 12.0. Underlying MLS content remains subject to the source's rights and terms.
Talk it through
Need a property-specific comparison?
Compare recent sales, current competition and the relevant details for your property.
Request a review of comparable sales for your property.