

August 2026 research edition
Denver Contract Activity Peaked Before New Listings in All Three Years Reviewed

Published
Data through ; extracted .
Accepted-contract activity peaked one to two months before new listings in each of the three completed years reviewed: 2023, 2024 and 2025. Across the six-county Denver research area, contracts peaked in March or April, new listings peaked in May or June, and completed sales peaked in May in all three years.
This calendar is drawn from monthly REcolorado / InfoSparks counts. It describes the years available in the extract, not a long-run seasonal norm or a proven best month to list a home. The activity series contain different groups of listings, so the sequence is not an individual property's path from listing to contract to closing.
When did each type of housing activity peak?
Scroll horizontally to see all columns.
| Year | Contract peak | Contracts | New-listing peak | New listings | Closing peak | Closings |
|---|---|---|---|---|---|---|
| 2023 | April | 4,206 | June | 5,307 | May | 4,295 |
| 2024 | April | 4,098 | May | 6,514 | May | 4,285 |
| 2025 | March | 4,372 | May | 6,864 | May | 4,165 |
Peaks are the highest monthly counts within each completed calendar year. All figures use Adams, Arapahoe, Broomfield, Denver, Douglas and Jefferson counties. Boulder is excluded from these totals.
In 2023, accepted contracts peaked in April at 4,206, while new listings peaked two months later, in June, at 5,307. In 2024, contracts peaked in April at 4,098, one month before the new-listing peak of 6,514 in May. In 2025, contracts peaked in March at 4,372, two months before May's new-listing peak of 6,864.
May was the highest closing-count month in each year: 4,295 in 2023, 4,285 in 2024 and 4,165 in 2025. Those closing peaks do not establish how long the contracts counted earlier took to close. Individual records are not linked across these monthly totals.
How much activity occurred in spring?
March through May accounted for 29.5% to 30.7% of each year's accepted contracts. New listings were more concentrated in that same three-month window by the end of the period: their share increased from 30.5% in 2023 to 34.5% in 2025.
Scroll horizontally to see all columns.
| Year | New listings, March–May share | Contracts, March–May share | Closings, March–May share |
|---|---|---|---|
| 2023 | 30.5% | 30.4% | 29.7% |
| 2024 | 31.9% | 29.5% | 28.6% |
| 2025 | 34.5% | 30.7% | 28.8% |
Every share uses its own metric's full calendar-year total. A share of annual new listings is not a share of annual contracts or a listing conversion rate.
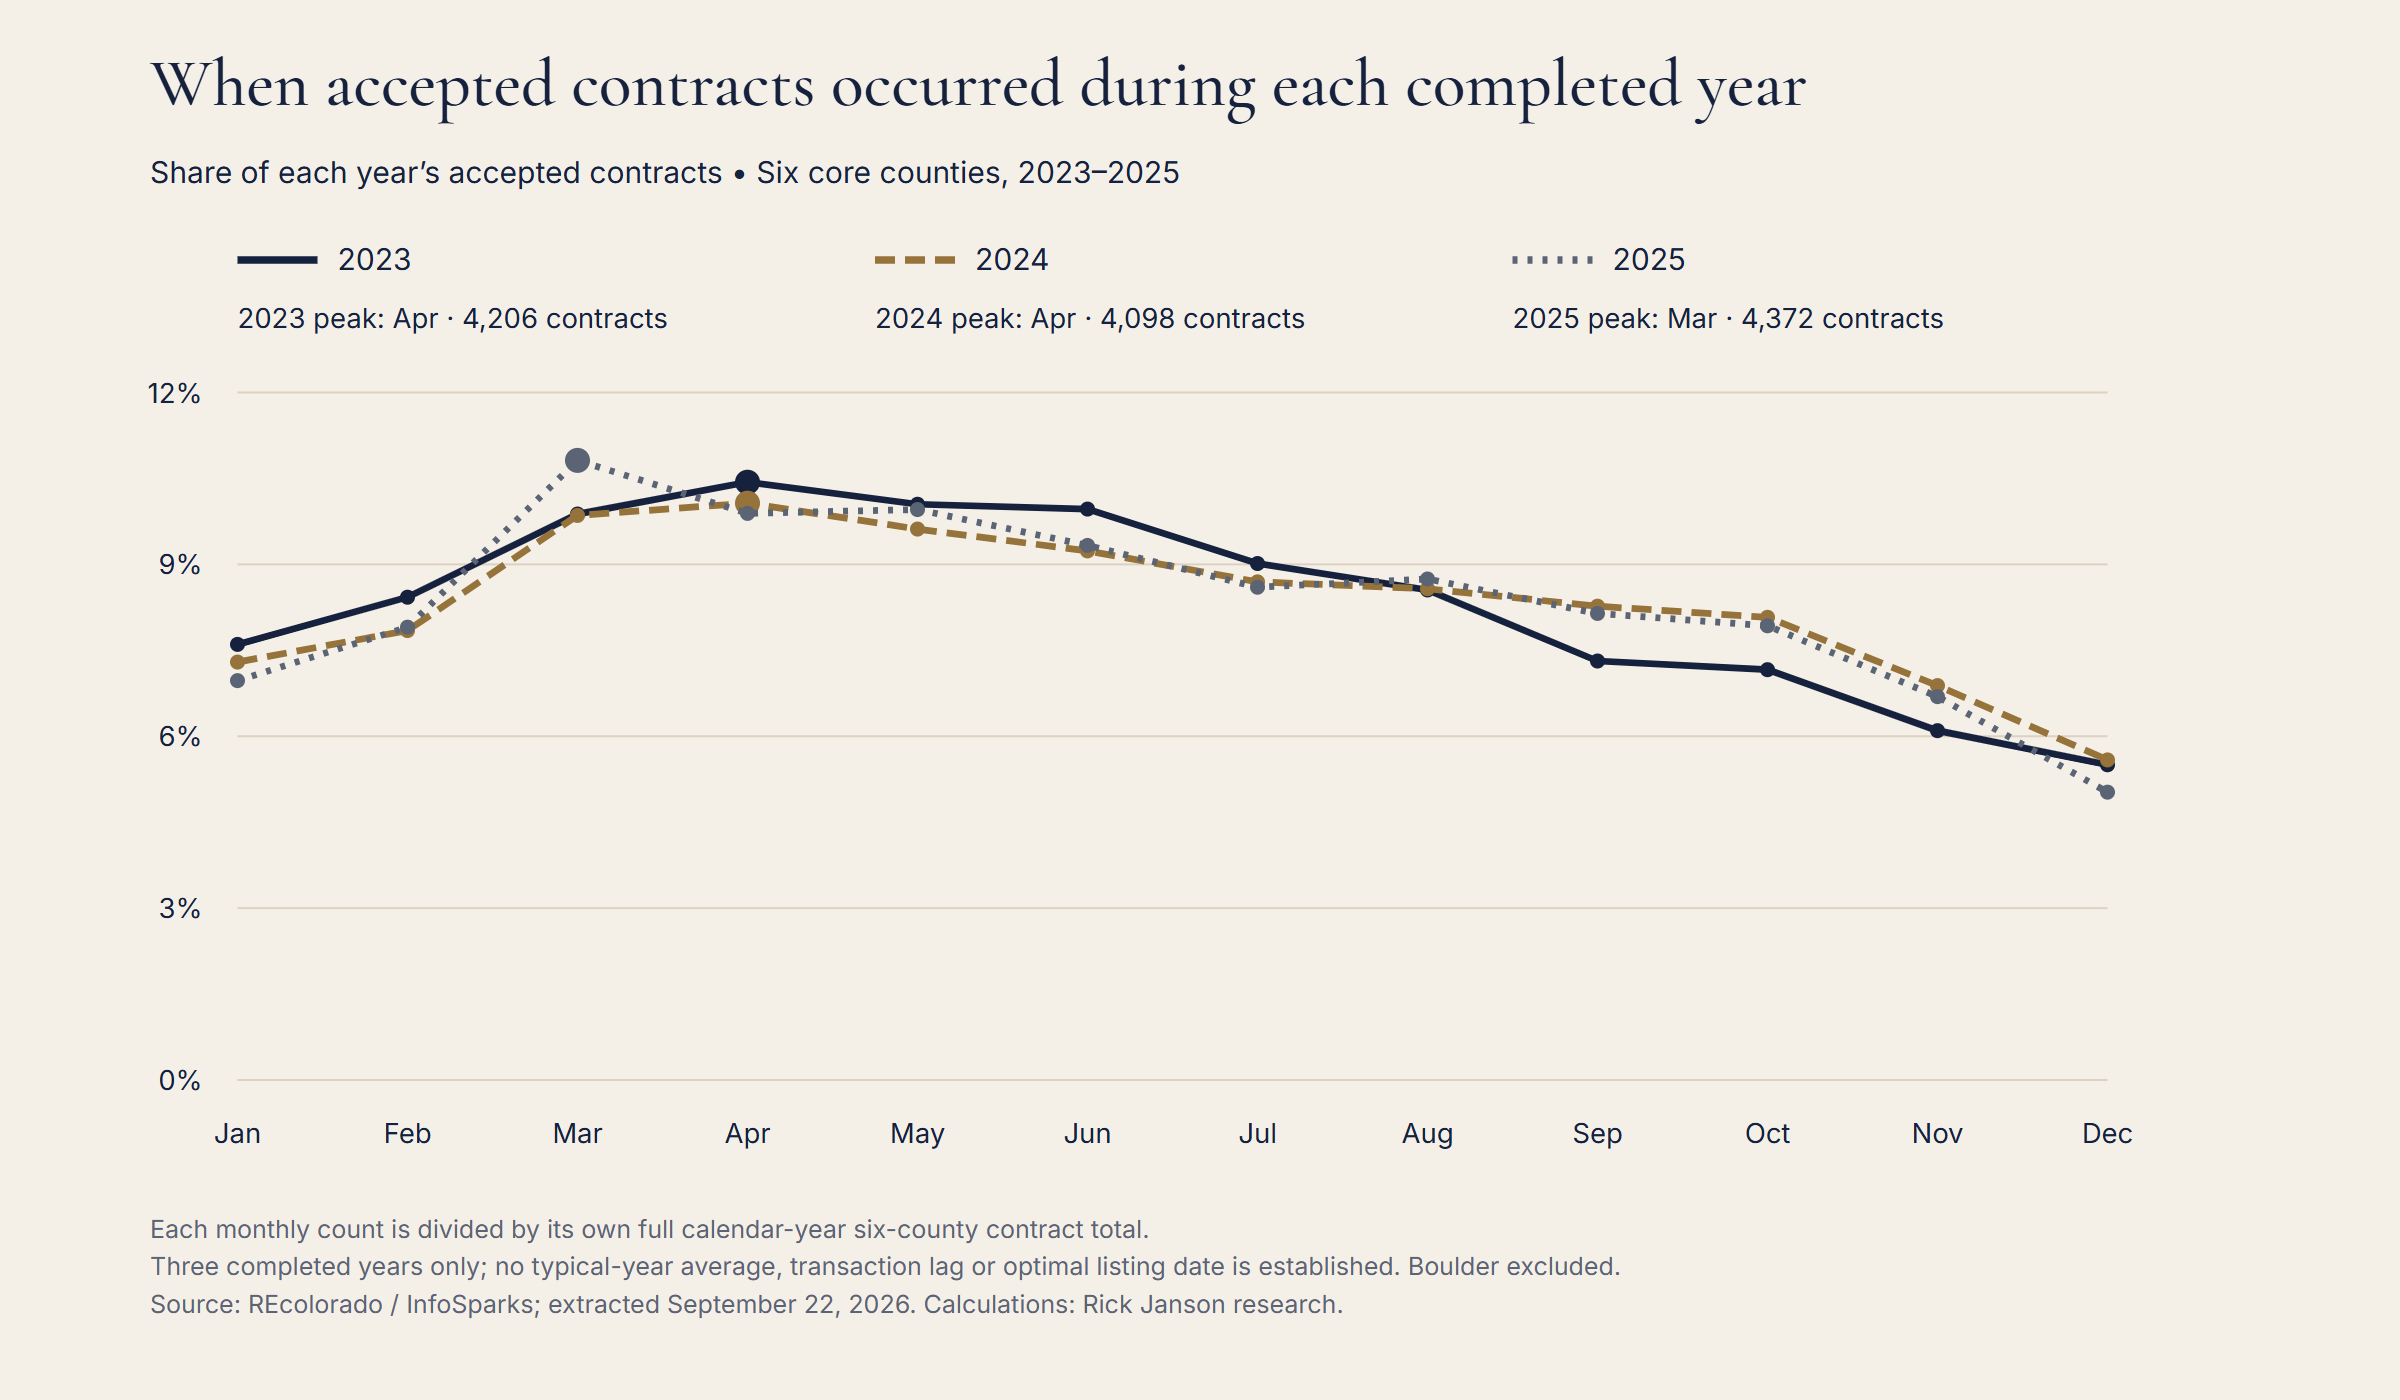
The distinction between the peak month and the share of activity across several months matters. A single highest month can change while the broader spring share stays within a narrower range. The contract peak moved from April to March, but roughly three-tenths of annual accepted-contract activity still occurred during March–May in all three observations.
The public data file preserves every month's count and annual share for all three metrics. It avoids compressing the three years into a single “typical year” curve that could hide their differences.
What does the August 2026 update add?
The current extract ends in August, so 2026 does not have a completed-year seasonal distribution. Its January–August totals can, however, be compared directly with January–August 2025.
Scroll horizontally to see all columns.
| Activity measure | Jan.–Aug. 2025 | Jan.–Aug. 2026 | Annual change |
|---|---|---|---|
| New listings | 43,229 | 42,419 | -1.9% |
| Accepted contracts | 29,192 | 28,528 | -2.3% |
| Closed sales | 27,932 | 27,319 | -2.2% |
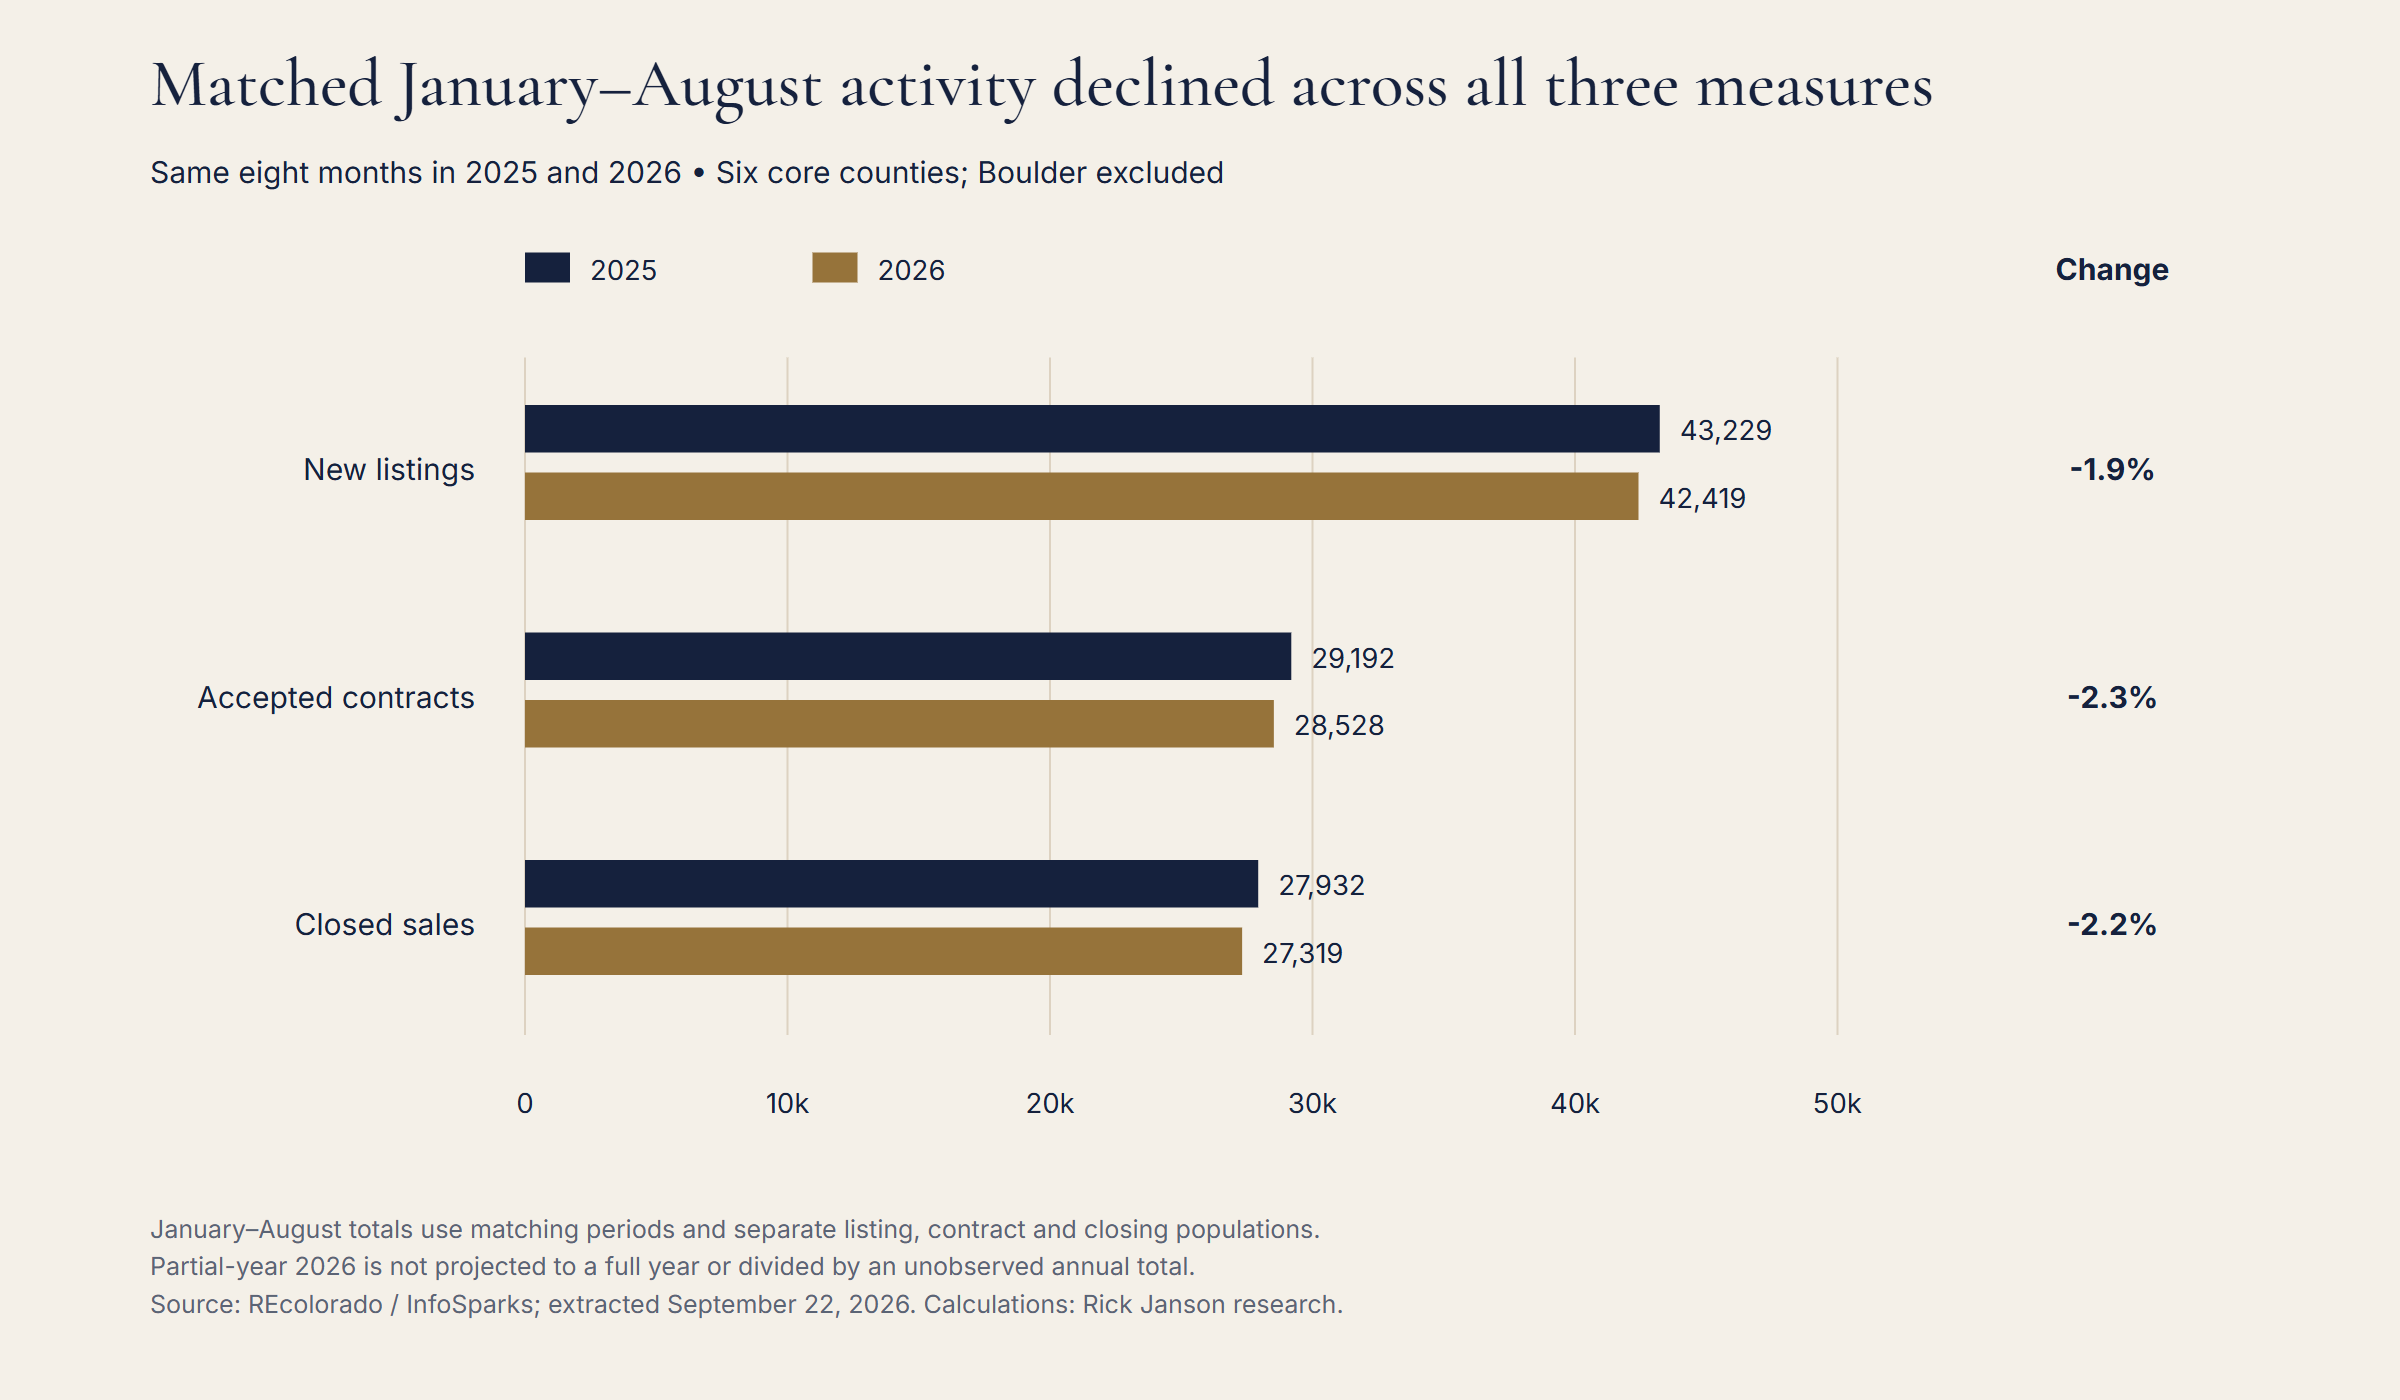
New listings were down 1.9%, accepted contracts down 2.3% and closed sales down 2.2% over that matched eight-month period. Those results describe cumulative activity through August. They do not project full-year totals or assign the first eight months a share of a not-yet-observed annual denominator.
The peak-month evidence from 2023–2025 is a historical frame for this update. It should not be used to fill in missing 2026 months or assume that the rest of the year will follow one of the prior curves.
Does an earlier contract peak mean listing earlier guarantees a better result?
No. A month with more accepted contracts does not by itself establish a higher sale probability, a shorter marketing time or a higher price for a particular home. The contract count may include listings that entered the market in earlier months. Supply, property mix, pricing and other conditions can also differ across the calendar.
The timing evidence can help organize a planning conversation, but it cannot select an optimal date on its own. A seller's property, readiness, relocation schedule and relevant competition still matter. The data supports saying when aggregate activity was highest in these years, not promising that moving a listing date would improve its outcome.
Why keep each completed year separate?
The three years have different activity totals. For example, new listings increased across the completed years, while the annual accepted-contract counts stayed close to 40,000. Comparing raw monthly counts alone blends changes in the annual total with changes in the distribution across months.
Annual shares address a narrower question: what portion of that year's activity occurred in a given month? Calculating each year's shares separately makes the denominator explicit. It also keeps an unusual month visible rather than smoothing it into an average calendar.
This is descriptive seasonal research. It does not remove seasonality through a statistical adjustment, establish a cycle that must recur or control for interest rates and other changing conditions.
Common questions about the Denver housing calendar
Which month had the most accepted contracts?
April in 2023 and 2024, and March in 2025, within the defined six-county area. These are three completed-year observations, not a universal answer for every year or neighborhood.
Which month had the most closings?
May in all three completed years reviewed. Closing counts represent different transaction cohorts from same-month new listings and accepted contracts.
Is spring the proven best time to sell?
This dataset does not establish that. It measures aggregate activity, not the causal effect of listing in one season rather than another on an individual seller's outcome.
Why not compare 2026 monthly shares with the full-year shares?
The extract contains only January–August 2026. A share calculated from that partial-year denominator would answer a different question from a share of a full calendar year's activity.
For related local evidence, see Denver Housing Market, August 2026: More Listings, Fewer Contracts, Denver Housing Inventory Is 88% Above 2023, but Flat Year Over Year, Denver Homes Sell Near Asking Even as Four County Price Medians Fall, Denver Home-Price Measures Disagree in Half of Core Counties, Fewer Contracts, Shorter Marketing Times in Five Denver-Area Counties, Fewer Showings Before Contract in Four Denver-Area Counties, Adams Gained Denver-Area Sales Share Even as Its Closings Fell, and Denver Months of Supply Rose Mostly Through a Slower Contract Pace. For a buyer or seller evaluating a specific home, comparable properties and the listing's circumstances provide the relevant evidence.
Methodology and source evidence
This edition uses 6 unchanged REcolorado / InfoSparks Monthly CSV exports covering 3 metrics, seven counties and 44 months, January 2023–August 2026. The core research geography is Adams, Arapahoe, Broomfield, Denver, Douglas and Jefferson. Boulder is outside all core totals. The combined filters include all residential property subtypes and price ranges; this is not a luxury-only or detached-only study and does not claim an official MSA boundary.
All 132 overlapping Jefferson County values matched and were deduplicated, leaving 924 unique source values. The extracted metrics are Closed Listings, New Listings, Pending Listings. The source vintage is September 22, 2026. Historical values can change in later exports.
Annual percentage changes compare the same calendar month or explicitly matched multi-month window: (current / prior − 1) × 100. Counts may be summed across distinct counties and periods; monthly activity sums are not deduplicated unique buyers or households. County or monthly medians are never pooled or averaged into broader medians. Ratios and shares use their stated numerators and denominators. Changes in percentages are expressed in percentage points where appropriate.
The analysis is descriptive. It does not establish causes, individual-home outcomes or statistical significance. Each metric's coverage and the additional limits explained above govern its interpretation. No new live-data refresh was performed for this edition.
Download the supporting tables
Metric definitions: InfoSparks manual, which may require login. Public source context: REcolorado market trends.
Suggested citation: Janson, Rick. “Denver Contract Activity Peaked Before New Listings in All Three Years Reviewed.” Denver Seasonal Listing and Contract Calendar, Report No. 9, August 2026 edition. Calculations from REcolorado / InfoSparks monthly county exports, extracted September 22, 2026. Published September 22, 2026. https://www.rickjanson.com/research/denver-seasonal-calendar/2026-08/
Based on information from REcolorado®, Inc. for the period January 1, 2023 through August 31, 2026.
REcolorado statistical-publication policy, Section 12.0. Underlying MLS content remains subject to the source's rights and terms.
Talk it through
Need a property-specific comparison?
Compare recent sales, current competition and the relevant details for your property.
Request a review of comparable sales for your property.