

August 2026 research edition
Denver Contract and Closing Declines Converged in August

Published
Data through ; extracted September 22, 2026.
Accepted contracts fell 11.3% and completed sales fell 10.7% across the six-county Denver research area in August 2026 compared with a year earlier. The gap between their annual changes narrowed to 0.6 percentage point, compared with 6.7 percentage points in June.
June had presented a different combination: contracts were down while closings were up. By August, both activity measures were declining at similar rates. This report traces that shift using separate monthly REcolorado / InfoSparks counts, without treating them as a matched pipeline of individual transactions.
How did the two activity measures change through the summer?
Scroll horizontally to see all columns.
| Month | 2025 contracts | 2026 contracts | Contract change | 2025 closings | 2026 closings | Closing change | Change gap |
|---|---|---|---|---|---|---|---|
| 2026-06 | 3,772 | 3,597 | -4.6% | 3,966 | 4,046 | +2.0% | +6.7 pp |
| 2026-07 | 3,477 | 3,198 | -8.0% | 3,748 | 3,655 | -2.5% | +5.5 pp |
| 2026-08 | 3,535 | 3,137 | -11.3% | 3,490 | 3,118 | -10.7% | +0.6 pp |
Each annual change compares the indicated 2026 month with the same month in 2025. The gap equals the closing percentage change minus the contract percentage change, in percentage points.
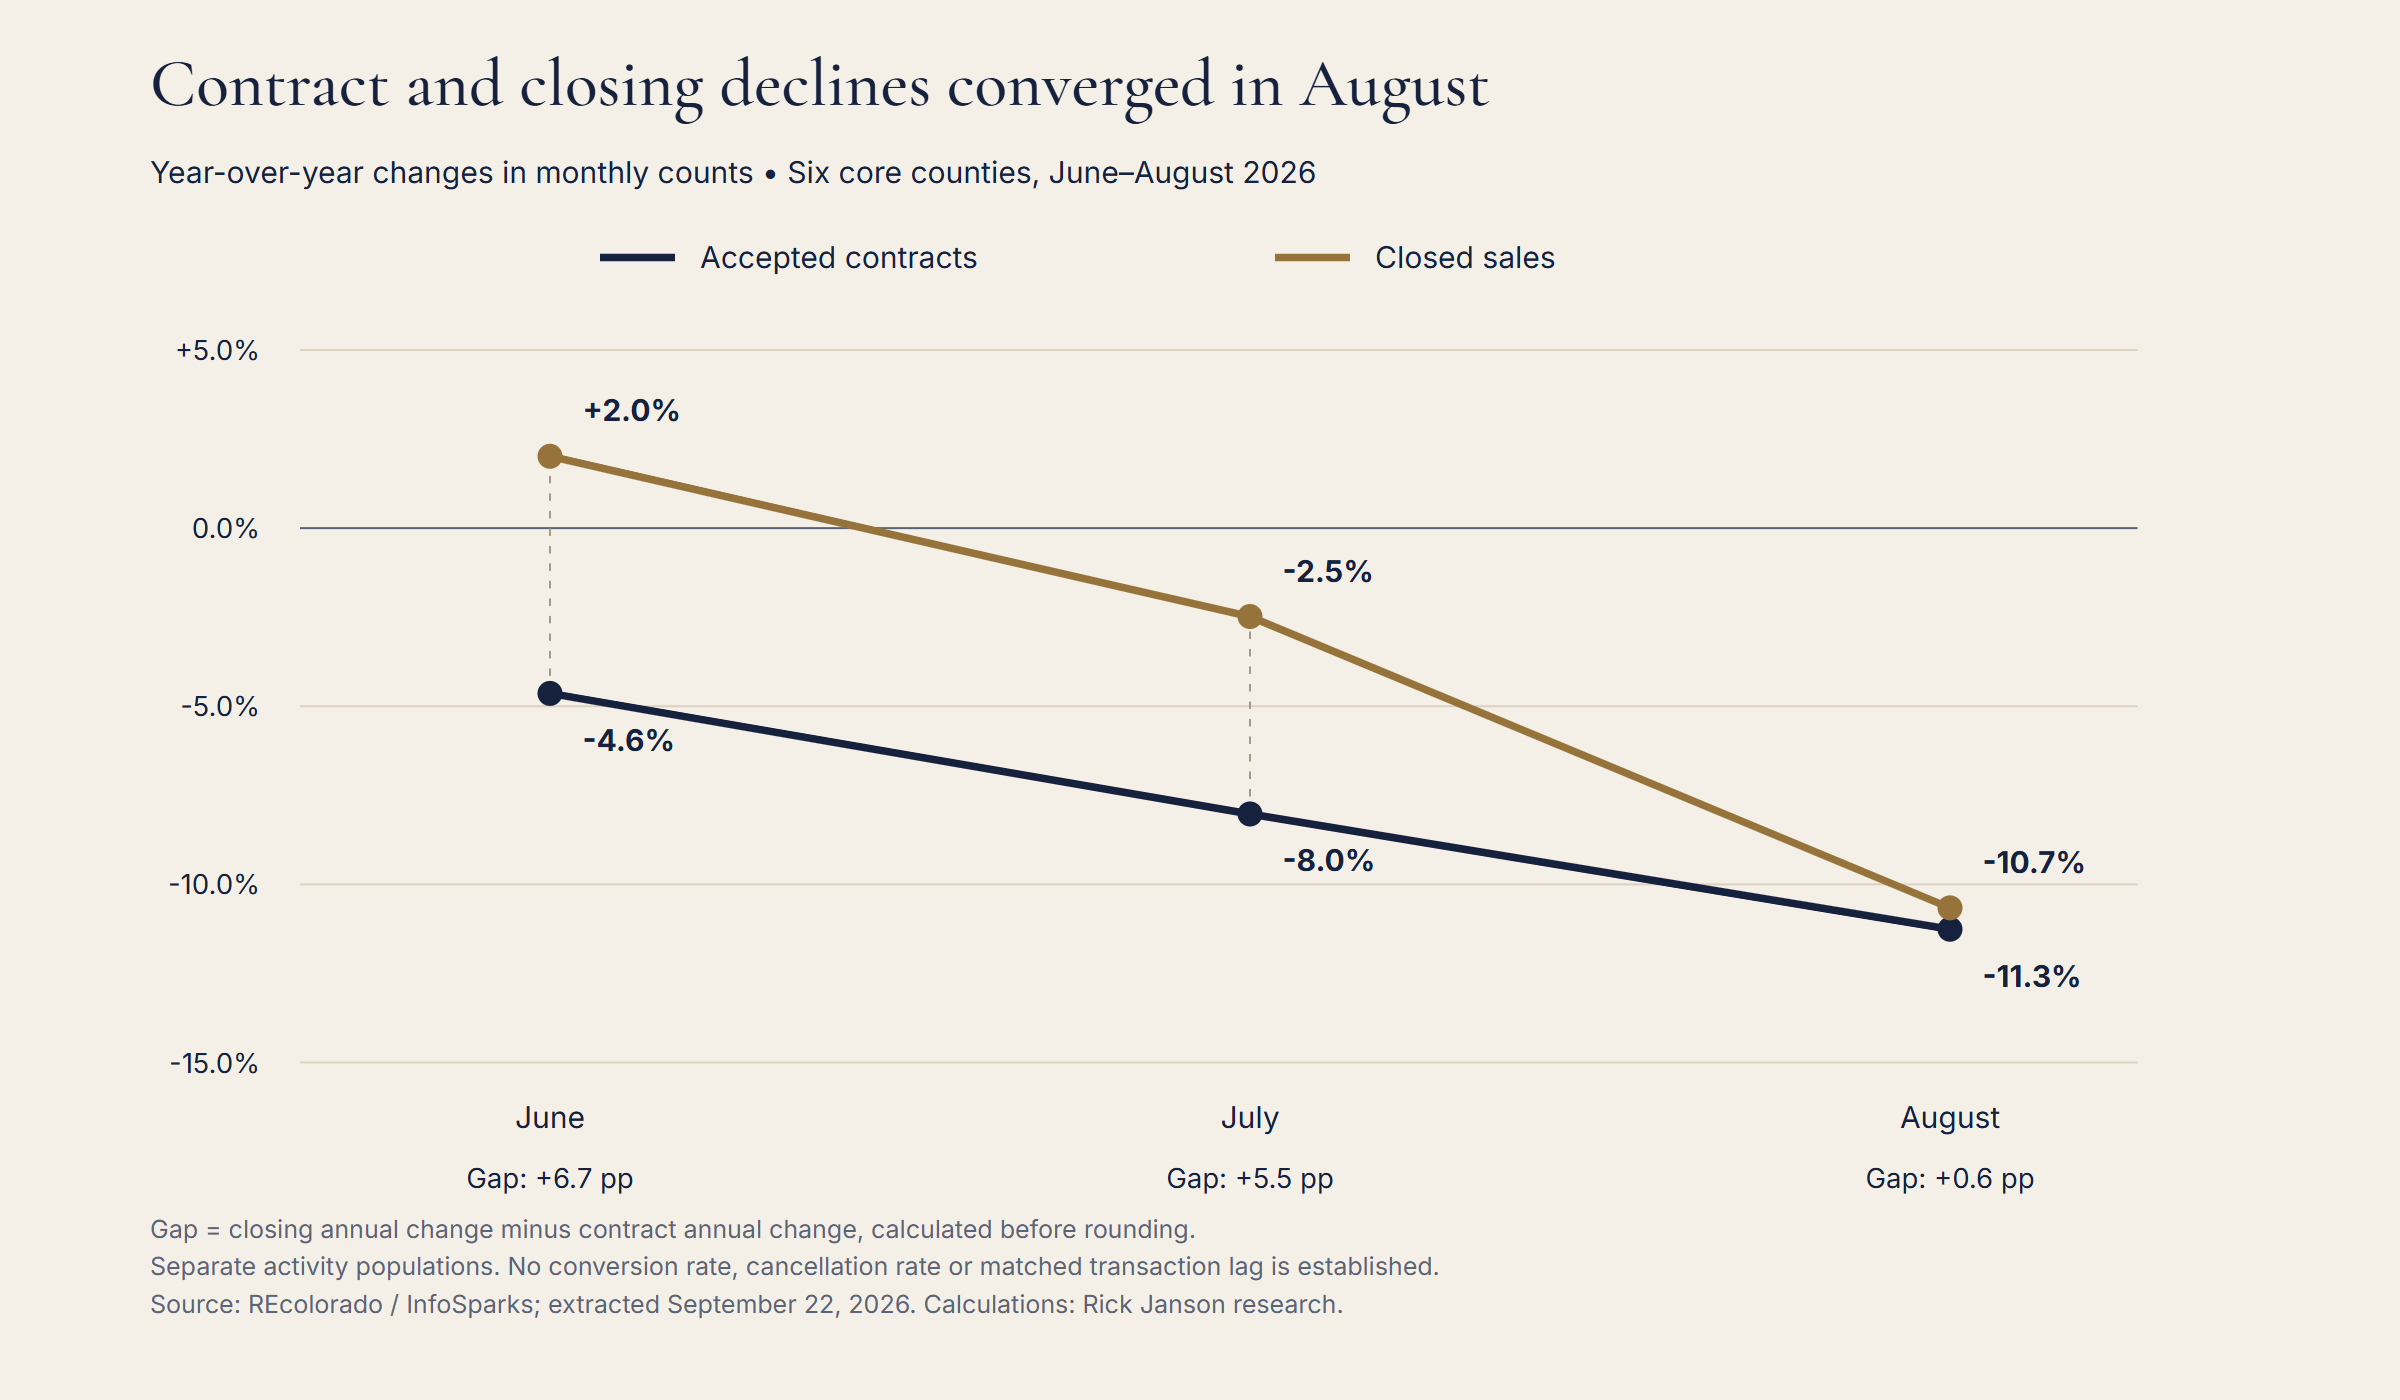
In June, accepted contracts declined from 3,772 to 3,597, down 4.6%, while completed sales increased from 3,966 to 4,046, up 2.0%. In July, both were lower: contracts declined 8.0%, while closings declined 2.5%.
By August, accepted contracts were 3,137 versus 3,535 a year earlier, and closings were 3,118 versus 3,490. The two growth rates were much closer than they had been in June. That is the observed convergence; it does not prove that the specific contracts counted in early summer produced the closings counted later.
What does the three-month total show?
Across June–August, the core recorded 9,932 accepted-contract events versus 10,784 in 2025, down 7.9%. Completed sales totaled 10,819 versus 11,204, down 3.4%. The contract decline was therefore larger over the full matched three-month window even though the August rates were close.
Scroll horizontally to see all columns.
| Matched window | 2025 contracts | 2026 contracts | Contract change | 2025 closings | 2026 closings | Closing change |
|---|---|---|---|---|---|---|
| June–August | 10,784 | 9,932 | -7.9% | 11,204 | 10,819 | -3.4% |
| January–August | 29,192 | 28,528 | -2.3% | 27,932 | 27,319 | -2.2% |
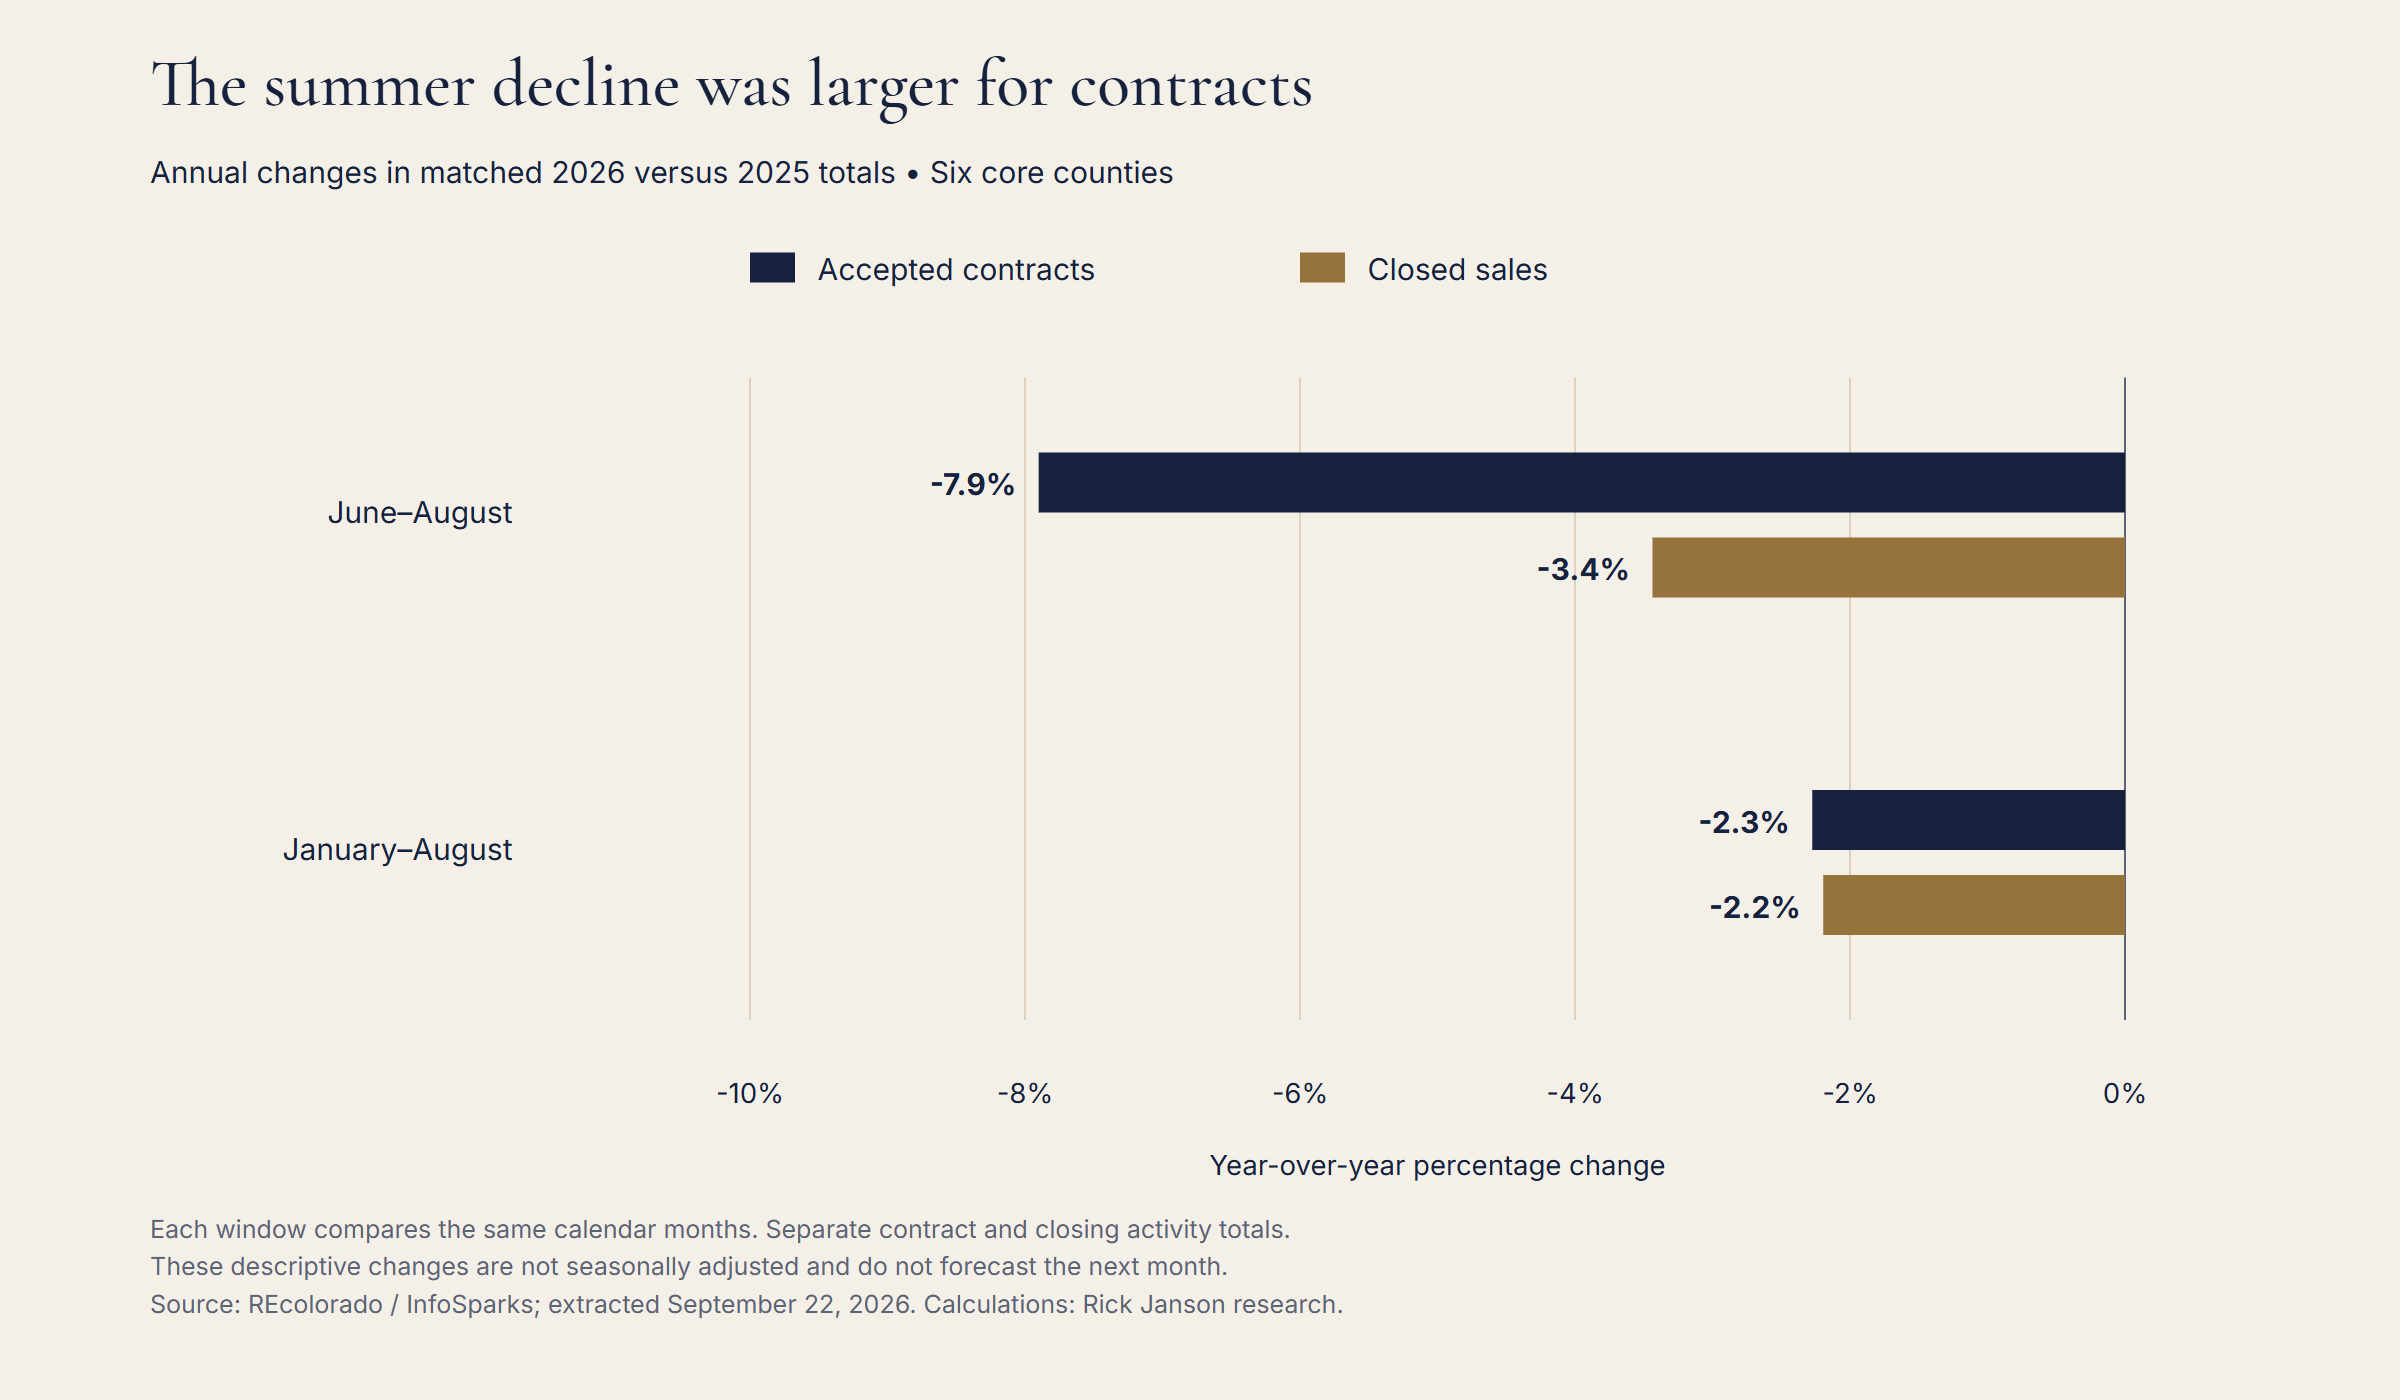
The January–August totals tell another, longer-window story: contracts were down 2.3% and closings down 2.2%. The summer weakness was larger than the cumulative year-to-date decline, particularly for contract activity. A report using only the eight-month totals would obscure that difference in the latest three months.
These windows are chosen explicitly and compared with the same calendar months in the prior year. The results are not a seasonally adjusted trend or a forecast of September activity.
Were both measures down in every county?
Five of the six core counties had lower contracts and lower closings in August: Adams, Arapahoe, Denver, Douglas and Jefferson. Broomfield had increases in both, starting from smaller counts.
Scroll horizontally to see all columns.
| County | 2025 contracts | 2026 contracts | Contract change | 2025 closings | 2026 closings | Closing change |
|---|---|---|---|---|---|---|
| Adams | 656 | 562 | -14.3% | 592 | 559 | -5.6% |
| Arapahoe | 728 | 672 | -7.7% | 745 | 641 | -14.0% |
| Broomfield | 79 | 93 | +17.7% | 69 | 92 | +33.3% |
| Denver | 733 | 634 | -13.5% | 721 | 620 | -14.0% |
| Douglas | 646 | 506 | -21.7% | 633 | 554 | -12.5% |
| Jefferson | 693 | 670 | -3.3% | 730 | 652 | -10.7% |
| Boulder (separate) | 363 | 308 | -15.2% | 395 | 319 | -19.2% |
Boulder is a separate comparison and is excluded from all combined core counts.
Douglas had a 21.7% decline in accepted contracts and a 12.5% decline in closings. Denver's declines were 13.5% and 14.0%, respectively. Jefferson's contract count was down 3.3%, while its closings were down 10.7%. The relationship between the two annual rates therefore varied substantially by county.
Broomfield's contracts increased from 79 to 93, up 17.7%, and closings increased from 69 to 92, up 33.3%. Boulder separately had declines of 15.2% in contracts and 19.2% in closings.
Can a one-month lag explain the difference?
The support data includes an explicitly labeled one-month lag view: prior-month accepted-contract activity alongside current-month closings. That view helps readers inspect a possible timing alignment. It does not establish that one month is the typical closing interval or that the displayed counts refer to the same properties.
For example, July 2026 had 3,198 accepted contracts, while August had 3,118 closings. Dividing those figures would not produce a valid conversion rate. Some August closings may follow contracts accepted before July or during August, and some July contracts may close later or never close. These exports do not identify those paths.
The matched annual lag view compares July 2026 contracts with July 2025 contracts, and August 2026 closings with August 2025 closings. It keeps the dates visible and the populations separate. The downloadable lag file begins in February 2024 because the January 2024 comparison would require December 2022 data, which is outside this extract.
Does weaker contract activity predict the next closing count?
Accepted-contract activity is relevant context for future transactions, but this study does not estimate a forecasting model. It lacks contract-to-closing links, actual completion intervals, cancellation records and a validated model of changes in those relationships.
The supported finding is historical: June closing growth coexisted with declining contract activity; July and August showed declines in both; the annual rate gap narrowed. Describing that sequence is useful without converting it into a prediction or a causal claim.
For market reporting, show the two measures together, retain their actual dates and state which window is being discussed. That prevents a stronger closing month from being mistaken for stronger same-month contracting, or a slower closing month from being interpreted as an observed cancellation rate.
Common questions about contracts and closings
How much did Denver-area contracts and closings fall in August?
Within the six-county core, accepted contracts fell 11.3% to 3,137 and closed sales fell 10.7% to 3,118 compared with August 2025. Denver County alone is one part of those totals.
Why were June closings up when contracts were down?
The measures cover different activity populations and time points. That allows opposite changes to coexist. The exports cannot identify which timing, composition or cancellation mechanisms produced the observed combination.
Can this report calculate a cancellation rate?
No. A cancellation rate needs a defined contract cohort and its observed outcomes. Monthly contract and closing totals do not provide that linkage.
What is the 0.6-percentage-point August gap?
It is the difference between the unrounded annual closing change and annual contract change, rounded to one decimal. It is not a 0.6% cancellation rate, a conversion probability or a share of transactions.
For related local evidence, see Denver Housing Market, August 2026: More Listings, Fewer Contracts, Denver Housing Inventory Is 88% Above 2023, but Flat Year Over Year, Denver Homes Sell Near Asking Even as Four County Price Medians Fall, Denver Home-Price Measures Disagree in Half of Core Counties, Fewer Contracts, Shorter Marketing Times in Five Denver-Area Counties, Fewer Showings Before Contract in Four Denver-Area Counties, Adams Gained Denver-Area Sales Share Even as Its Closings Fell, Denver Months of Supply Rose Mostly Through a Slower Contract Pace, and Denver Contract Activity Peaked Before New Listings in All Three Years Reviewed. For a buyer or seller evaluating a specific home, comparable properties and the listing's circumstances provide the relevant evidence.
Methodology and source evidence
This edition uses 4 unchanged REcolorado / InfoSparks Monthly CSV exports covering 2 metrics, seven counties and 44 months, January 2023–August 2026. The core research geography is Adams, Arapahoe, Broomfield, Denver, Douglas and Jefferson. Boulder is outside all core totals. The combined filters include all residential property subtypes and price ranges; this is not a luxury-only or detached-only study and does not claim an official MSA boundary.
All 88 overlapping Jefferson County values matched and were deduplicated, leaving 616 unique source values. The extracted metrics are Closed Listings, Pending Listings. The source vintage is September 22, 2026. Historical values can change in later exports.
Annual percentage changes compare the same calendar month or explicitly matched multi-month window: (current / prior − 1) × 100. Counts may be summed across distinct counties and periods; monthly activity sums are not deduplicated unique buyers or households. County or monthly medians are never pooled or averaged into broader medians. Ratios and shares use their stated numerators and denominators. Changes in percentages are expressed in percentage points where appropriate.
The analysis is descriptive. It does not establish causes, individual-home outcomes or statistical significance. Each metric's coverage and the additional limits explained above govern its interpretation. No new live-data refresh was performed for this edition.
Download the supporting tables
Metric definitions: InfoSparks manual, which may require login. Public source context: REcolorado market trends.
Suggested citation: Janson, Rick. “Denver Contract and Closing Declines Converged in August.” Denver Contract and Closing Pulse, Report No. 10, August 2026 edition. Calculations from REcolorado / InfoSparks monthly county exports, extracted September 22, 2026. Published September 22, 2026. https://www.rickjanson.com/research/denver-contract-closing-pulse/2026-08/
Based on information from REcolorado®, Inc. for the period January 1, 2023 through August 31, 2026.